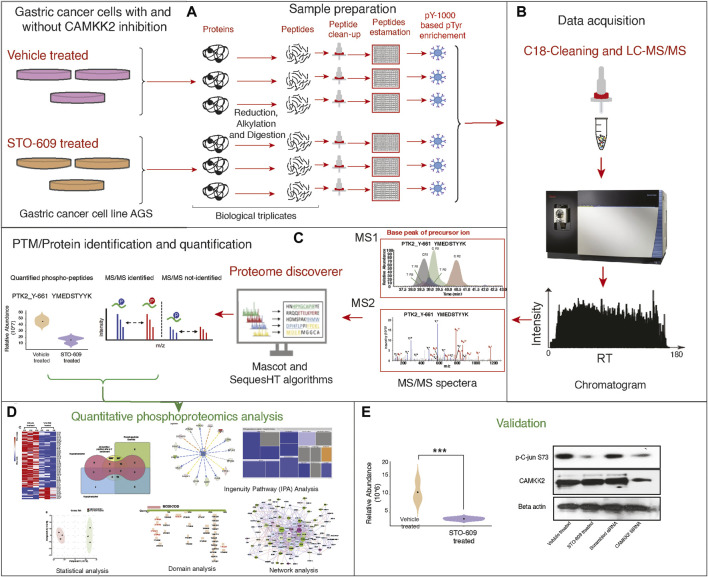
FIGURE 1.
Detailed experimental workflow for phospho-(Y)-proteomic analysis, data analysis, and functional validation in gastric cancer cells between STO-609-treated and DMSO control conditions. (A) Schematic representation adapted for sample preparation for identification and quantification of phospho-(Y)-proteomic changes in gastric cancer cells (AGS) treated with STO-609 and vehicle control (DMSO). (B) Schematic representation LC-MS/MS analysis. (C) Schematic representation for PTM/protein identification and quantification from LC-MS/MS data using proteomic platform Proteome Discoverer. (D) Bioinformatics analysis/data analysis of proteomic data obtained in gastric cancer cells (AGS) treated with STO-609 and vehicle control (DMSO). (E) Validation of protein expression identified from proteomic data analysis.

