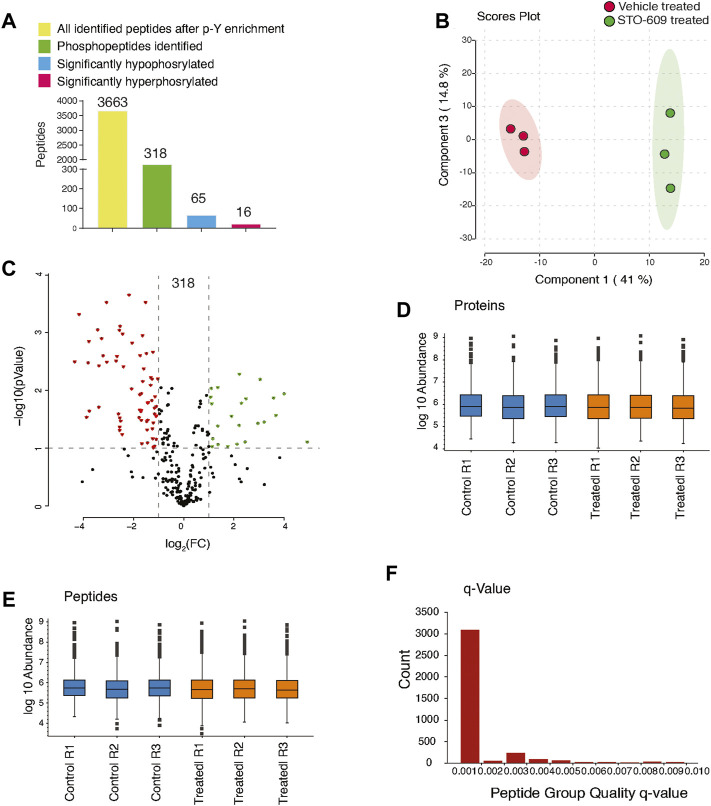
FIGURE 2.
Inhibition of CAMKK2 results in change in tyrosine phosphoproteome in gastric cancer cells. (A) Bar graph summarizes phospho-Y-proteomic changes in gastric cancer cells (AGS) treated with 18.5 μM STO-609 and vehicle control. (B) Principal component analysis of control and CAMKK2-inhibited AGS cells. (C) Volcano plot showing the distribution of phosphopeptides upon STO-609 treatment 18.5 µM for 2 h. (D) Box plot showing the sum of protein abundances between the control and STO-609–treated AGS cells across the triplicates. (E) Box plot showing the sum of peptides abundances between the control and STO-609–treated AGS cells across the triplicates. (F) The bar graph shows the q-value of peptides.

