FIGURE 5.
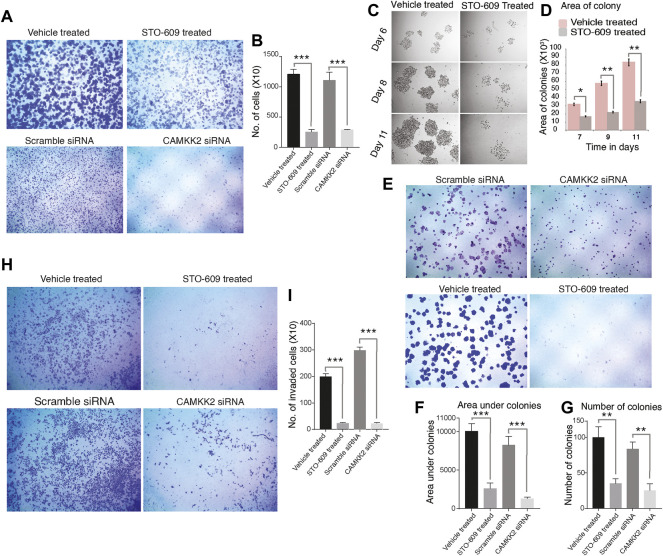
Inhibition or silencing of CAMKK2 leads to reduced cellular proliferation, invasion, migration, and colony formation in AGS cells. (A) Cellular proliferation of AGS cells upon CAMKK2 inhibition with STO-609 or silencing by CAMKK2 siRNA. Proliferated cells were stained with crystal violet and visualized under a microscope at 1× magnification. (B) Bar diagram depicting cellular proliferation activity of AGS cells upon CAMKK2 inhibition/silencing (***p < 0.001). (C) Representative images of colonies obtained from AGS cells upon STO-609 treatment; DMSO used as vehicle control. Photographs were taken at indicated time points at 10× magnification. (D) A bar diagram depicts colony size in AGS cells upon CAMKK2 inhibition (*p < 0.05, **p < 0.01). (e) Colony formation assay of AGS cells upon CAMKK2 inhibition by STO-609 or silencing with CAMKK2 siRNA. Colonies formed were stained with crystal violet to visualize under a microscope (1× magnification). (F,G) Results obtained from colony formation assay are represented as a bar chart showing colony number and area under colonies (**p < 0.01, ***p < 0.001). (H) Invasion assay to see the cellular invasion of AGS cells following treatment with STO-609, with DMSO used as vehicle control, and CAMKK2 siRNA or Scramble siRNA. Invasion assays were carried out in a transwell system using Matrigel-coated filters, and migrated cells to the lower chamber were counted. Cells were stained with crystal violet and visualized in a microscope (10× magnification). (I) Graphical representation of invasive ability of AGS cells upon CAMKK2 inhibition or silencing (***p < 0.001).

