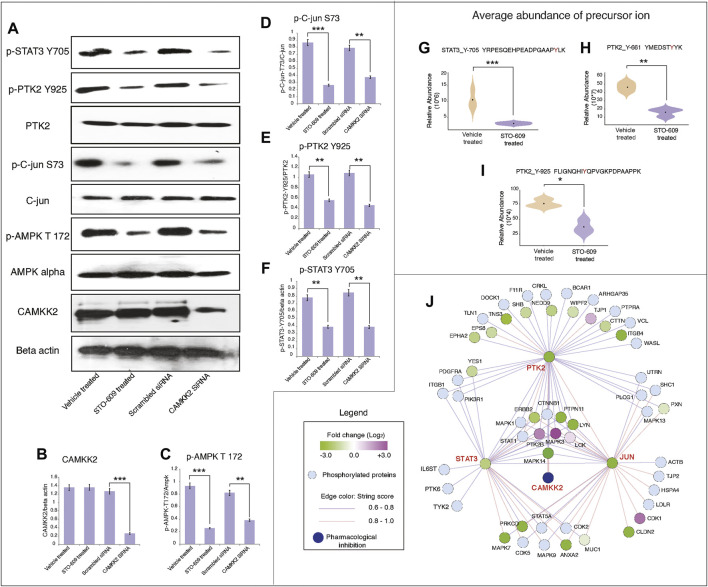
FIGURE 6.
Inhibition of CAMKK2 decreased phosphorylation of PTK2/c-JUN and STAT3 signaling in gastric cancer cells. (A) Expression of indicated proteins in gastric cancer cells (AGS) on inhibition or silencing of CAMKK2 as indicated; β-Actin was used as a loading control. (B) Densitometry graph representing the expression of CAMKK2 for conditions depicted in (A) (***p < 0.001). (C) Densitometry graph representing the expression p-AMPK depicted in (A) (**p < 0.01, ***p < 0.001). (D) Densitometry graph representing the expression p-c-JUN depicted in (A) (**p < 0.01, ***p < 0.001). (E) Densitometry graph representing the expression p-PTK2 depicted in (A) (**p < 0.01). (F) Densitometry graph representing the expression p-STAT3 depicted in (A) (**p < 0.01). (G–I) Violin plot showing the expression of p-STAT3 and p-PTK2 from mass spectrometry data. (J) Network analysis of hypophosphoproteins in AGS cells upon CAMKK2 inhibition using the STRING (Version 11:0) database.

