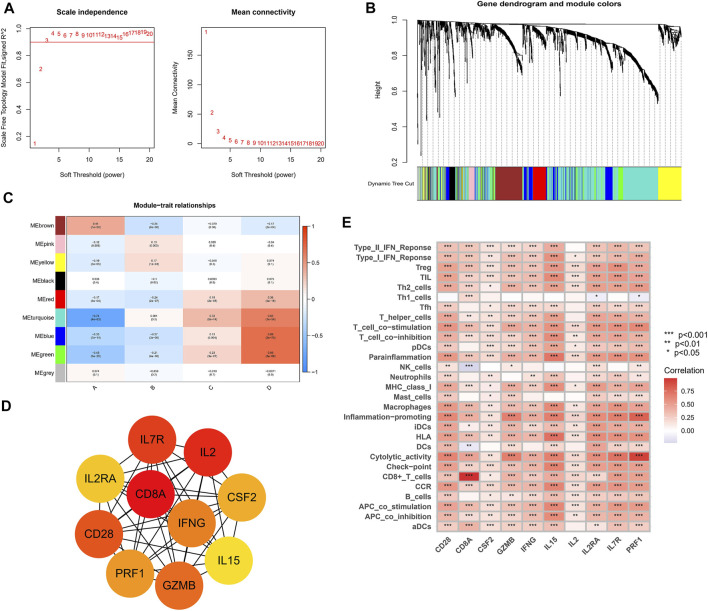
FIGURE 11.
Weighed co-expression analysis of immuno-related genes in the TCGA cohort. (A) Selection of soft thresholding power (B) Gene dendrogram and the correlation modules. (C) Heat map of module-trait relationships. (D) Hub genes and their internal correlation network. (E) Correlation heat map for hub genes and immune gene sets.

