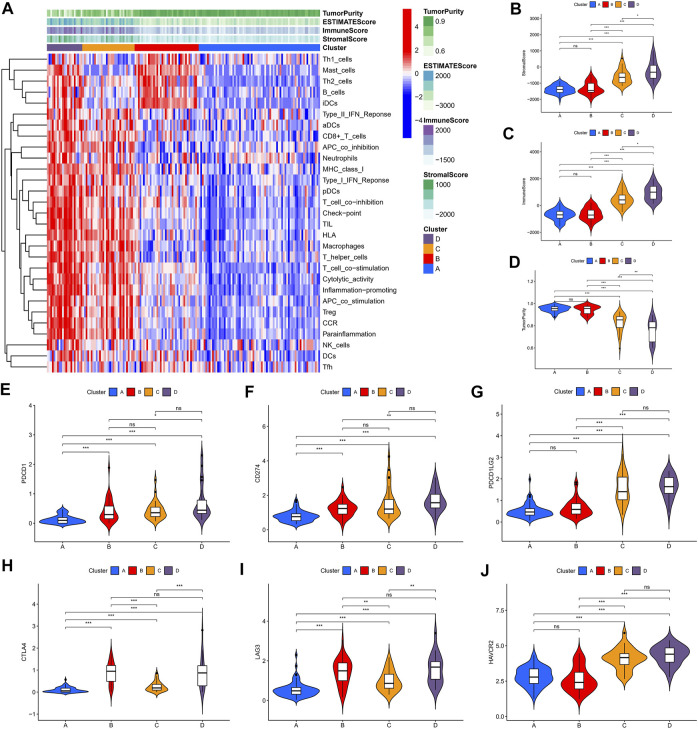
FIGURE 4.
Immune characteristics of the four clusters in the CGGA-2 dataset. (A) Heat map of the four immune clusters based on ssGSEA scores. (B) Stromal scores, (C) immune scores, and (D) tumor purity of different clusters. (E–J) Violin plots for the immune checkpoint gene expressions of PDCD1, CD274, PDCD1LG2, CTLA-4, LAG3, and HAVCR2 in different clusters.

