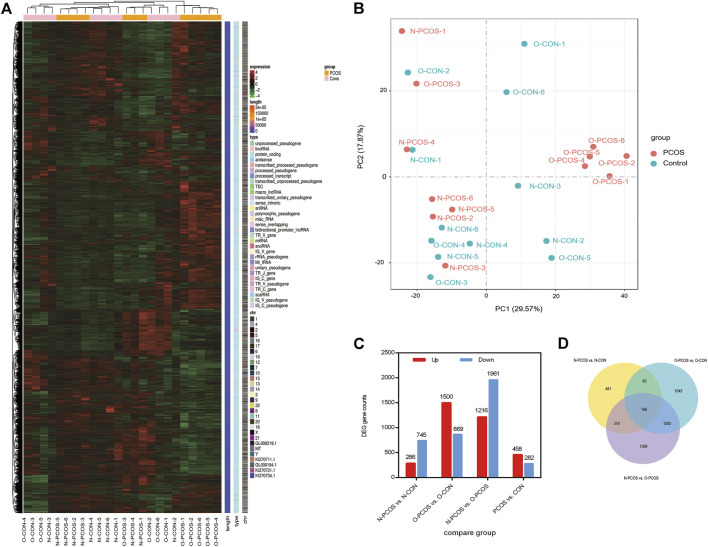
FIGURE 1.
Changes in gene expression profiles of the endometrium between PCOS and controls. (A) Unsupervised hierarchical clustering of all gene expression in 24 subjects, six normoweight PCOS (N-PCOS), six overweight/obese PCOS (O-PCOS), six normoweight controls (N-CON), and six overweight/obese controls (O-CON). (B) PCA plot of RNA-Seq transcriptomes in the endometrium between PCOS and controls. (C) Numbers of DEGs in pairwise comparisons. (D) Venn diagram showing the number of DEGs in each comparison, and the overlaps between the three main comparison groups.

