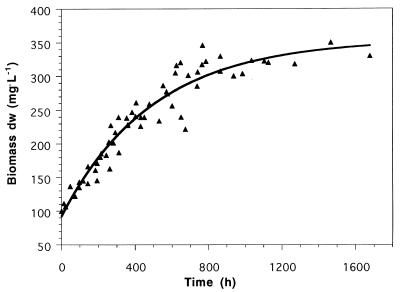
FIG. 3.
Biomass concentrations in milligrams (dry weight) per liter of three retentostat runs with N. winogradskyi (rs = 1.42 mmol of NaNO2− · h−1 in all runs). The data show the increase in biomass after it reached 100 mg (dry weight) per liter in the retentostat mode. The solid line represents the best fit. The fitted value for m was 2.8 μmol of NO2− per mg (dry weight) per h.

