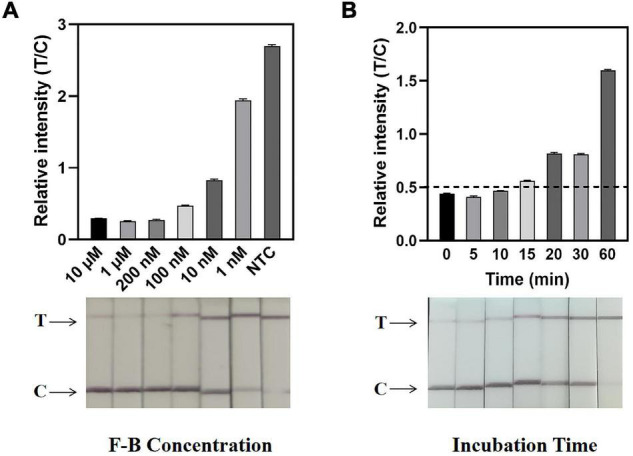
FIGURE 4.

Determination of F-B concentration and reaction time by the ERA/CRISPR–Cas12a dipstick system. (A) Concentration optimization of the dipstick probe (F-B). The relative intensities of the band are shown at the top, and the dipstick results for different F-B concentrations are shown below. (B) An optimal incubation time of the CRISPR–Cas12a system. The black horizontal dashed line in the gray scan indicates the cutoff value set based on T/C values of the negative control. Error bars in panels represent the mean ± SD, where n = 3 replicates.
