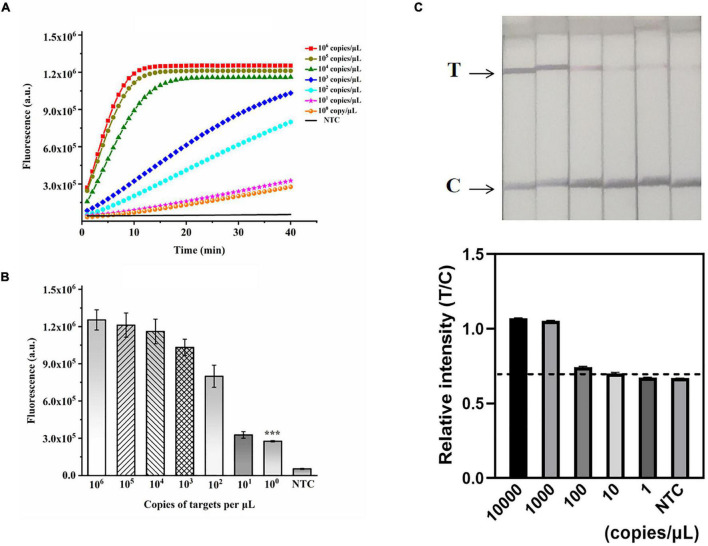
FIGURE 5.
Validation of the sensitivity of the ERA/CRISPR–Cas12a dual system. (A) Fluorescence curves generated by the ERA/CRISPR–Cas12a fluorescence system at each dilution. (B) Comparison of fluorescence values generated after 40 min of ERA/CRISPR–Cas12a fluorescence system reaction at each dilution. ***p<0.001. (C) Analytical sensitivity of the ERA/CRISPR–Cas12a dipstick system at each dilution. The black horizontal dashed line in the gray scan indicates the cutoff value set based on T/C values of the negative control. Error bars in panels represent the mean ± SD, where n = 3 replicates.

