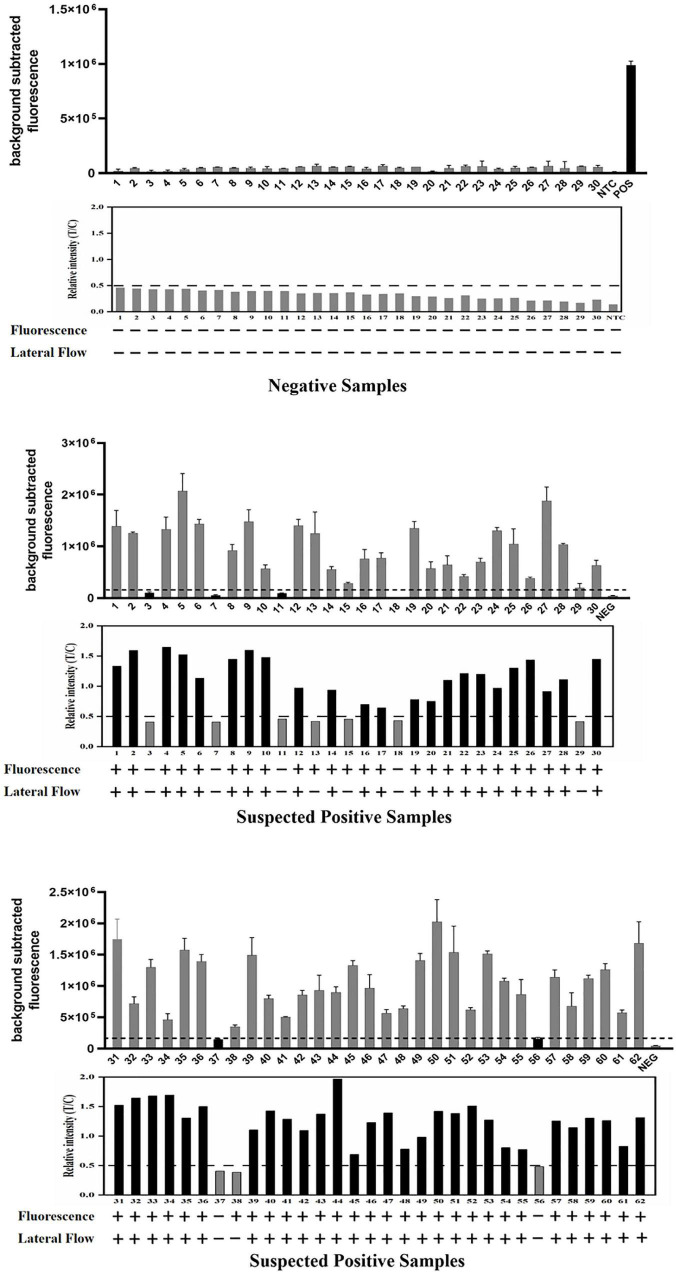
FIGURE 7.
Detection of 92 clinical samples by the ERA/CRISPR–Cas12a dual system for M. pneumoniae. For each group of results, the detection results of the ERA/CRISPR–Cas12a fluorescence system are displayed at the top, the gray scan results of the strips are displayed in the middle, and the bottom is the interpretation results of the dual system. Background subtracted fluorescence was the fluorescence intensity of the experimental group against the blank control. Black horizontal dashed line indicates the threshold for a positive result. + : indicates a positive sample, −: indicates a negative sample. Error bars in panels represent the mean ± SD, where n = 3 replicates.

