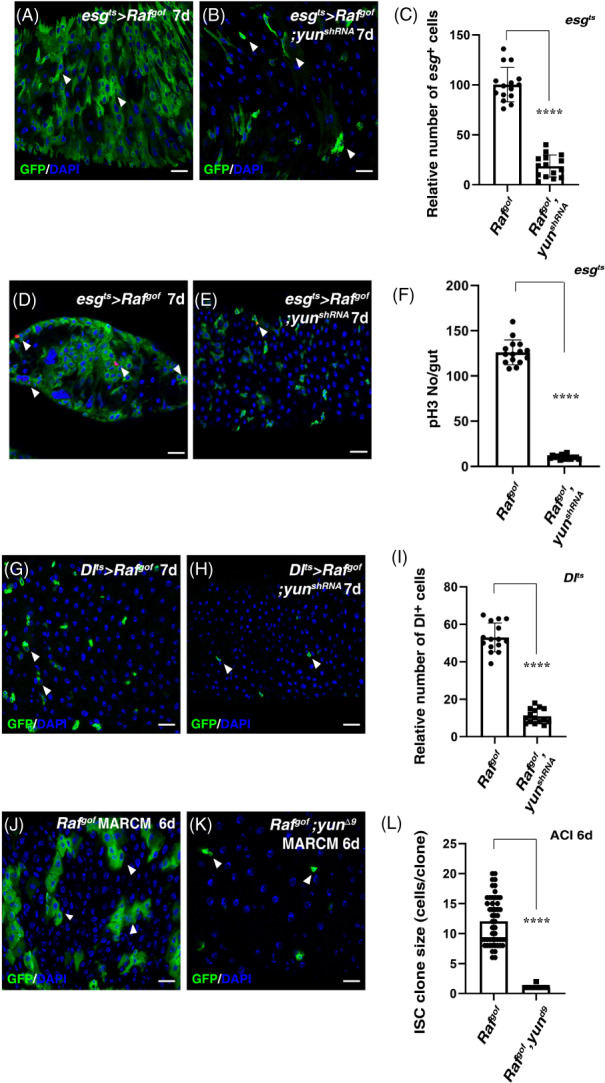
FIGURE 2.

Yun is required for tumorigenesis. (A) Expression of Raf gof in esg + cells causes tumours (green, by esg > GFP) at 29°C for 7 days (white arrowheads). (B) The number of tumour cells in esg ts s Raf gof intestines (green, by esg > GFP) is dramatically decreased by co‐expression of yun shRNA at 29°C for 7 days (white arrowheads). (C) Quantification of the relative number of ISCs in esg ts > Raf gof intestines and esg ts > Raf gof , yun shRNA intestines. Mean ± SD is shown. n = 15. ****p < 0.0001. Please note that esg ts > Raf gof intestines are highly deformed which prevent the accurate quantification of esg + cells in esg ts > Raf gof intestines. (D) pH 3 (red) in esg ts > Raf gof intestines at 29°C for 7 days (white arrowheads). (E) pH 3 (red) in esg ts > Raf gof , yun shRNA intestines at 29°C for 7 days (white arrowheads). (F) Quantification of pH 3 number per gut in esg ts > Raf gof intestines and esg ts > Raf gof , yun shRNA intestines. Mean ± SD is shown. n = 15. ****p < 0.0001. (G) Expression of Raf gof in ISCs increases ISC number at 29°C for 7 days (white arrowheads). (H) The number of ISCs in Dl ts > Raf gof intestines is significantly decreased by co‐expression of yun shRNA at 29°C for 7 days (white arrowheads). (I) Quantification of the relative number of ISCs in Dl ts > Raf gof intestines and Dl ts > Raf gof , yun shRNA intestines. Mean ± SD is shown. n = 15. ****p < 0.0001. (J) MARCM clones of Raf gof (green) at room temperature for 6 days after clone induction (ACI). (K) The size of Raf gof clone is totally suppressed in yun Δ9 (ACI 6 days). (L) Quantification of the clone size of indicated genotypes. Mean ± SD is shown. n = 15. ****p < 0.0001. In all panels except graphs, GFP is in green and blue indicates DAPI staining of DNA. Scale bars: 20 μm
