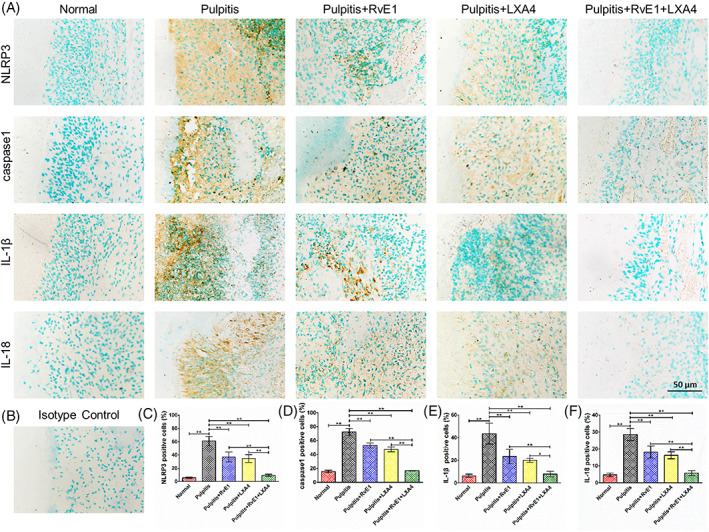
FIGURE 6.

(A) Representative immunohistochemistry‐stained images of NLRP3, caspase‐1, IL‐1β, and IL‐18 of day 3 samples. (B) Isotype control. Statistical analysis of (C) NLRP3‐, (D) caspase‐1‐, (E) IL‐1β‐ and (F) IL‐18‐positive cells. (*p < 0.05 and **p < 0.01)
