FIG. 2.
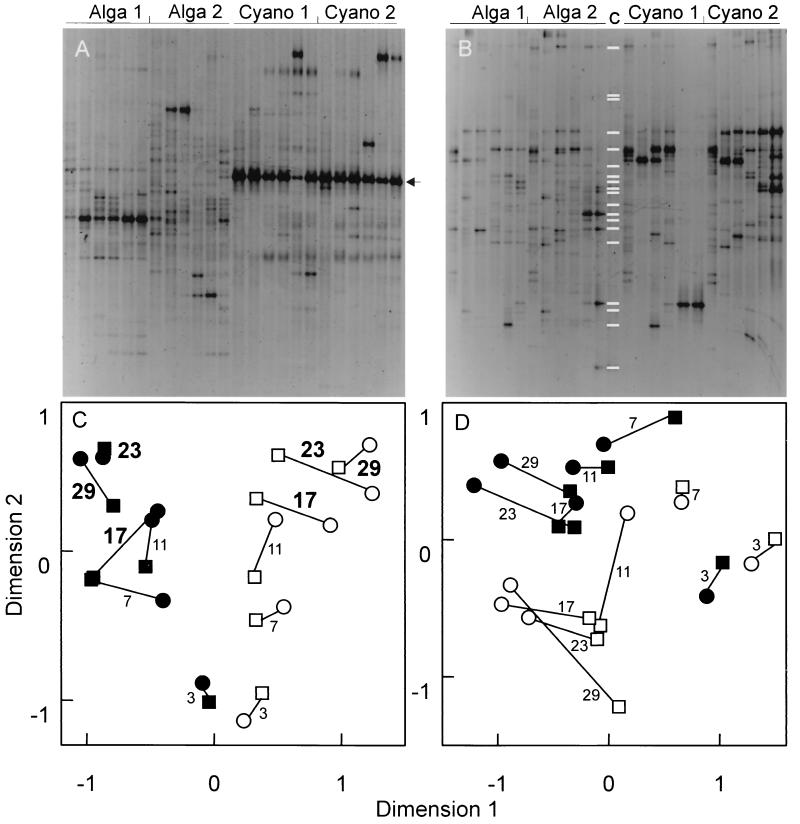
Structures of the microbial communities depending on the source of detritus (green algae or cyanobacteria). (A) 16S rDNA-defined (bacterial) community, as revealed by DGGE. (B) 18S rDNA-defined (eukaryotic) community, as revealed by DGGE. (C) NMDS map of the bacterial communities grown on different types of detritus. (D) NMDS map of the eukaryotic communities grown on different types of detritus. Symbols: ○, Alga 1 stage; □, Alga 2 stage; ●, Cyano 1 stage; ■, Cyano 2 stage. The lines connect the community structures of replicate stages. The numbers indicate the numbers of days from the beginning of the experiment. Boldface numbers indicate significant differences (P < 0.05) in community structures between different sources of detritus. The white bands in panel B, lane c, indicate the band positions for the 18S rDNA clones (Table 1). For each of block of lanes, data for the six times when samples were obtained are shown in consecutive lanes. The arrow in panel A indicates the band belonging to O. limnetica; this band was not included in the Nei-Li distance calculation.

