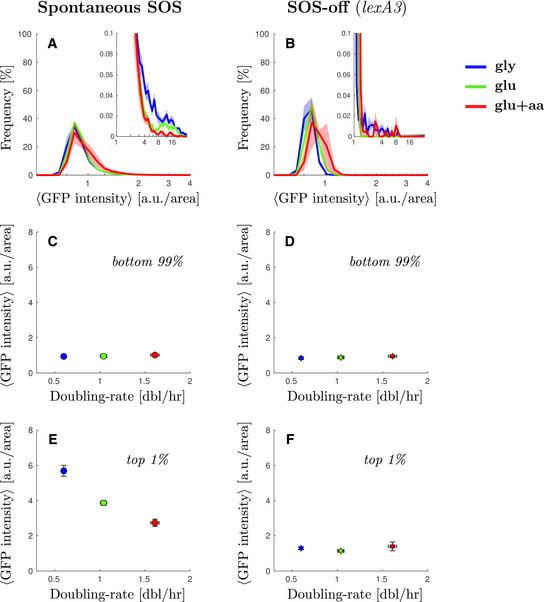
Steady‐state distribution of GFP intensity from SOS reporter PsulA‐mGFP for WT cells in different growth conditions (blue M9‐gly, green M9‐glu, red M9‐glu+aa). GFP fluorescence intensity was measured as arbitrary units of fluorescence per unit cell area. Solid line represents the average frequency and shaded area the standard error from at least 3 replicates done on different days. Inset: A magnification of the second peak at high SOS expression.
Steady‐state distribution of GFP intensity from SOS reporter PsulA‐mGFP for a strain unable to induce SOS (SOS‐off, lexA3 background) in different growth conditions. Solid line represents the average frequency and shaded area the standard error from at least 3 replicates done on different days. Inset: A magnification of the high‐fluorescence range of the distribution.
Average GFP intensity for the lower 99% of the population of WT cells as a function of growth rate. Points represent the average and bars the standard error from at least 6 biological repeats.
Average GFP intensity for the lower 99% of the population of lexA3 cells unable to induce SOS (SOS‐off, lexA3 background) as a function of growth rate. Stars represent the average and bars the standard error from at least 3 biological replicates done on different days.
Average GFP intensity for the top 1% of the population of wild type cells as a function of growth rate. Points represent the average and bars the standard error from at least three biological replicates done on different days.
Average GFP intensity for the top 1% of the population of lexA3 cells unable to induce SOS (SOS‐off, lexA3 background) as a function of growth rate. Stars represent the average and bars the standard error from at least three biological replicates done on different days.

