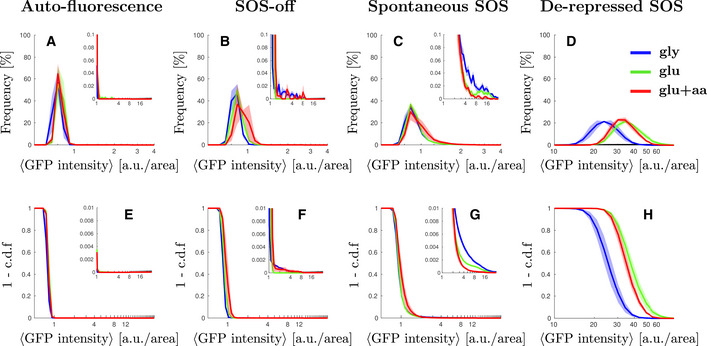
Figure EV1. Single cell distributions of GFP intensity without inducing DNA damage.

- Steady‐state distribution of GFP intensity from cell auto‐fluorescence in different growth conditions.
- Steady‐state distribution of GFP intensity from SOS reporter PsulA‐mGFP for cells unable to induce SOS (SOS‐off, lexA3 background) in different growth conditions. Figure panel reused from Fig 1B for comparison purposes.
- Steady‐state distribution of GFP intensity from SOS reporter PsulA‐mGFP for wild type cells in different growth conditions. Figure panel reused from Fig 1A for comparison purposes.
- ΔlexA ΔsulA background.
- Steady‐state cumulative distribution of GFP intensity from cell auto‐fluorescence in different growth conditions.
- Steady‐state cumulative distribution of GFP intensity from SOS reporter PsulA‐mGFP for cells unable to induce SOS (SOS‐off, lexA3 background) in different growth conditions.
- Steady‐state distribution of GFP intensity from SOS reporter PsulA‐mGFP for wild type cells in different growth conditions.
- ΔlexA ΔsulA background.
