
Figure 3. The transition rate to high‐SOS state is higher in fast‐growth conditions.
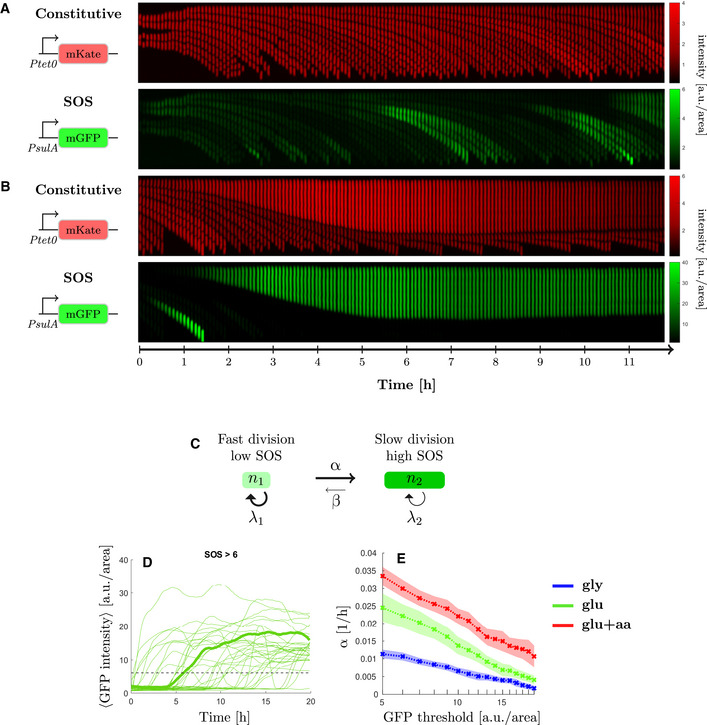
Representative kymographs of a strain experiencing replication‐dependent DSBs (2‐pal) in M9‐glucose+amino‐acids medium. Scale bars represent normalised intensity for constitutive reporter PtetO‐mKate2 and GFP intensity from SOS reporter PsulA‐mGFP.
- Example mother cell lineage with low level of SOS induction. Top, constitutive expression of mKate, bottom PsulA‐mGFP.
- Example mother cell lineage inducing a high level of SOS. Top, constitutive expression of mKate, bottom PsulA‐mGFP. Cell division is inhibited while cell growth continues and eventually stops.
- Switching model. Cells with low levels of SOS induction rate switch at rate α to a high SOS level state and switch back at rate β (with βα).
- GFP intensity trajectories of SOS induction observed in the 2 palindrome strain as a function of time. One trajectory has been highlighted in bold. The dashed line corresponds to the threshold discriminating between high and low‐SOS cells.
- Switching rate estimated for multiple GFP intensity thresholds under replication‐dependent DSBs (2‐pal) in different growth conditions (see Appendix Supplementary Methods for the estimation). The switching rate is always higher in rich than in poor nutrient. Points represent the average and the shaded area the standard error from three biological repeats.