
FIGURE 6.
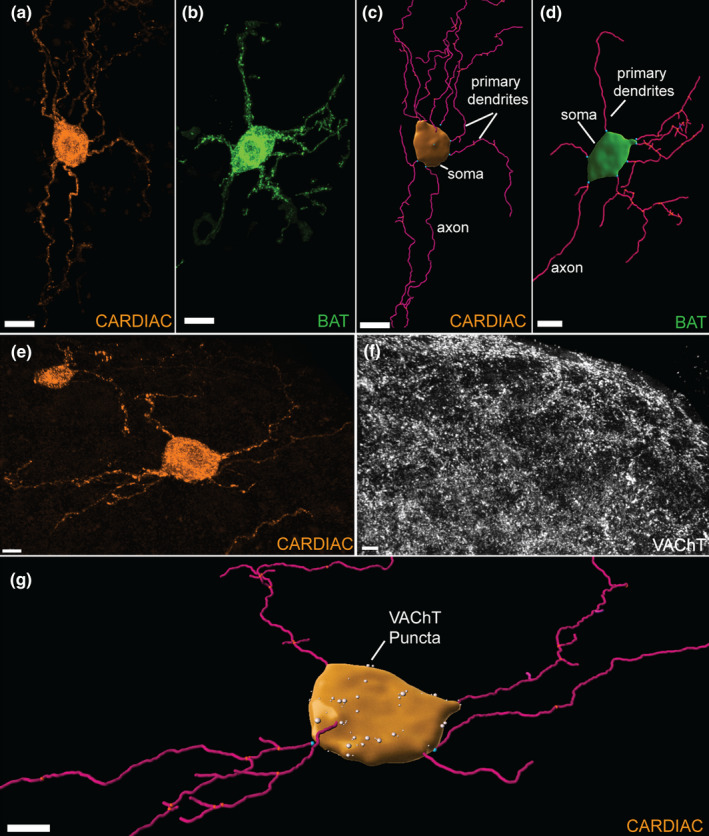
Representative confocal images and 3D reconstructions of stellate ganglia (SG) sympathetic neurons. (a): Confocal image of a cardiac‐projecting SG neuron (scale bar =15 µm). (b): Confocal image of a BAT‐projecting SG neuron (scale bar =20 µm). A region of interest and selective masking was used to isolate single neurons in a confocal scan for analysis. (c): A 3D reconstruction of the cardiac‐projecting neuron (a); (d): 3D reconstruction of the BAT‐projecting neuron (b). (c and d): Imaris Surfaces‐ and Filaments‐generated objects modeled soma and dendrites. Each primary dendrite branch point is labeled blue. The soma volume (µm3) and number of primary dendrites of each cell was assessed. (e): A confocal image of a cardiac‐projecting SG neuron. (f): A confocal image showing vesicular acetylcholine transporter (VAChT) puncta in SG. (g): Imaris reconstructions of a cardiac‐projecting neuron and VAChT puncta (white spots) that were apposed to the soma surface. Scale bars for E, F, and G = 10 µm.