
Figure 1.
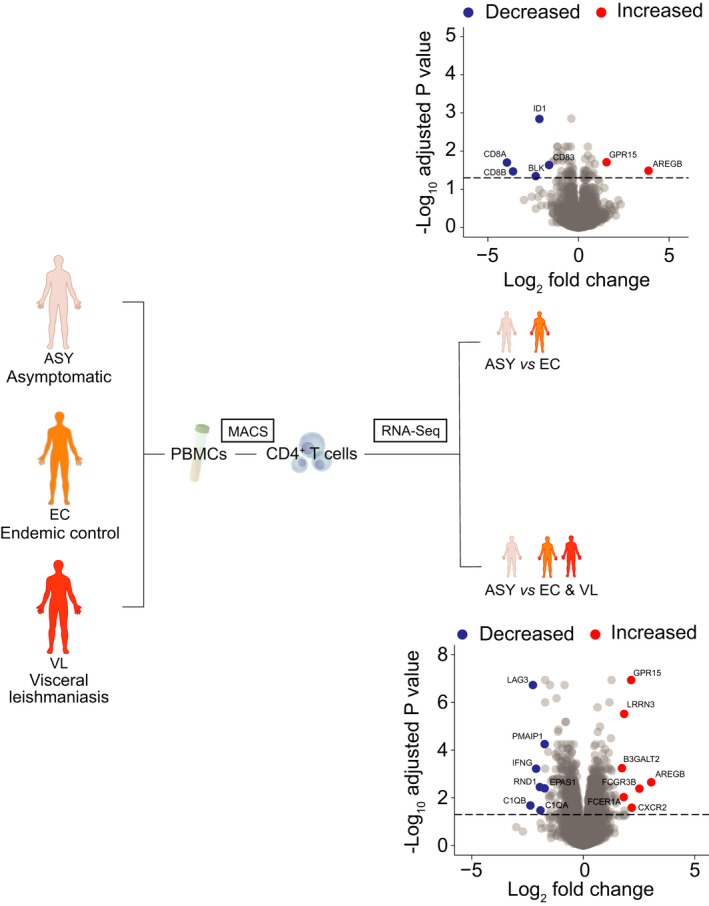
Defining a transcriptomic signature of peripheral blood CD4+ T cells from asymptomatic (ASY) individuals infected with Leishmania donovani. A schematic showing the approach taken to identify transcriptomic signatures of peripheral blood CD4+ T cells from ASY individuals, endemic controls (EC) and visceral leishmaniasis (VL) patients (n = 12 biological replicates in each group). A volcano plot of the differentially expressed genes identified in the comparison of asymptomatic versus endemic controls (upper plot) and ASY versus the average of VL patients and EC. Genes are coloured red (upregulated) or blue (downregulated) according to a false discovery rate < 0.05. Gene labels are shown for selected genes.