
Figure 3.
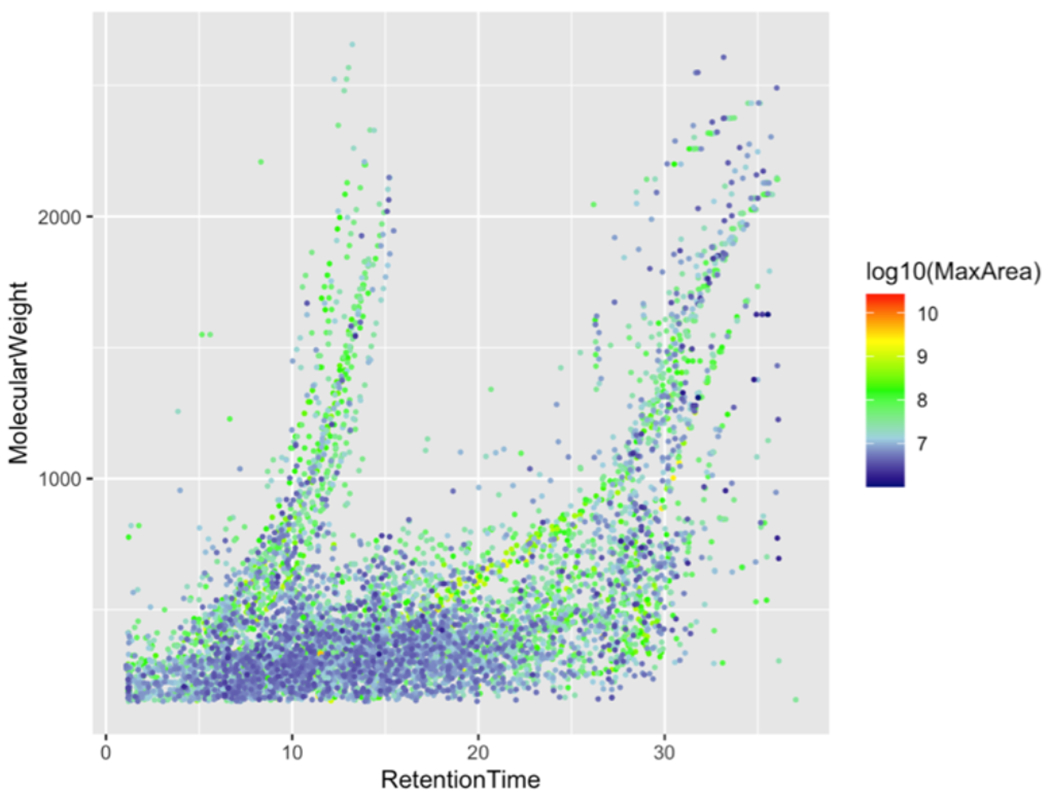
Molecular weight vs. retention time map of non-redundant compounds detected in Bay water POCIS and WWTP effluent extracts. Compounds are colored by log 10 transformed maximum peak area.
Official websites use .gov
A
.gov website belongs to an official
government organization in the United States.
Secure .gov websites use HTTPS
A lock (
) or https:// means you've safely
connected to the .gov website. Share sensitive
information only on official, secure websites.
Molecular weight vs. retention time map of non-redundant compounds detected in Bay water POCIS and WWTP effluent extracts. Compounds are colored by log 10 transformed maximum peak area.