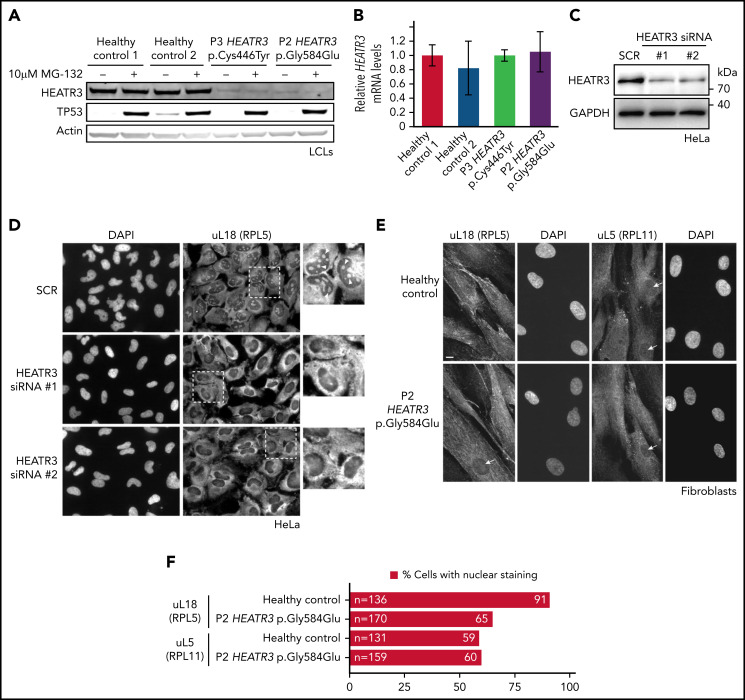
Figure 3.
HEATR3 variants affect protein levels and uL18 nuclear localization. (A) Representative western blot of lysates from LCLs derived from P2 and P3 that were either untreated or exposed to the proteasome inhibitor MG-132. Specific antibodies are used to detect the relative amounts of HEATR3. Protein p53 provides a positive control showing proteasome inhibition by MG-132. Actin detection was used as loading control. (B) Real-time polymerase chain reaction analysis of complementary DNAs generated from LCLs derived from a healthy control or from P2 and P3 using primers to measure HEATR3 mRNA levels. The mRNAs of genes 36B4, ACTB, and GAPDH were used as references. Data shown are the results of 6 biological replicate experiments. (C) Western blot of lysates from HeLa cells transfected with 2 different siRNAs targeting HEATR3 (#1 and #2) or a control scrambled siRNA (SCR) probed with antibodies against HEATR3. Glyceraldehyde-3-phosphate dehydrogenase (GAPDH) detection was used as loading control. (D) Wide-field fluorescence microscopy of HeLa cells transfected with SCR or HEATR3 siRNAs and stained with 4′,6-diamidino-2-phenylindole (DAPI) (to label the nucleus) and antibodies against uL18, shown at ×20 magnification. The insets show enlarged pictures of the areas framed by dotted lines. The arrowheads point to stained nucleoli, which are observed in control cells but not after HEATR3 knockdown. (E) Fibroblasts derived from a healthy control or P2, stained with DAPI and antibodies against uL18 or uL5. Scale bar, 10 μm. (F) Quantification of the number of fibroblasts revealing nuclear staining of uL18.

