Figure 3.
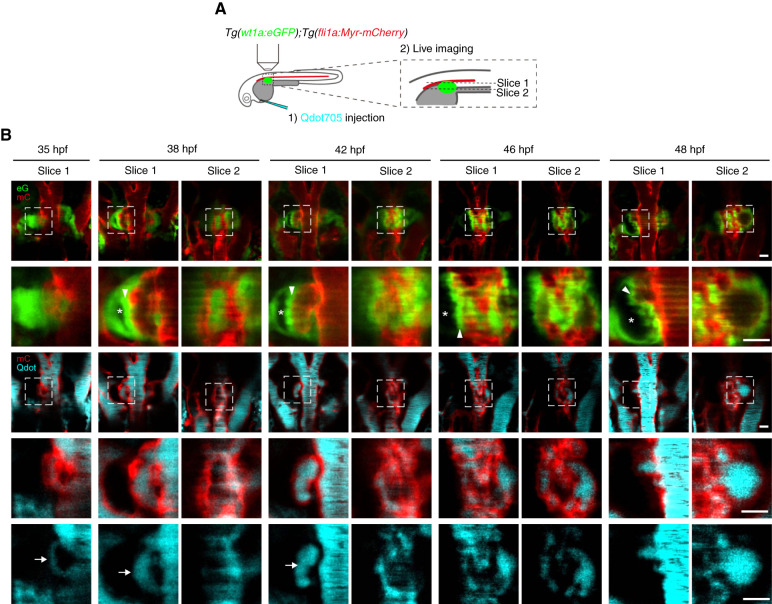
Blood circulation in the capillaries during glomerular morphogenesis. (A) Schematic illustration showing the experimental procedure to visualize the blood flow in glomerular capillaries. Tg(wt1a:eGFP);Tg(fli1a:Myr-mCherry) embryos were intravascularly injected with Qdot705, mounted dorsal-side up in 1% low-melting agarose, and imaged with a confocal upright microscope as described in the Materials and Methods section. (B) Single z-plane images showing the dorsal (slice 1) and ventral (slice 2) parts of the glomerular primordia or glomeruli in Tg(wt1a:eGFP);Tg(fli1a:Myr-mCherry) embryos injected intravascularly with Qdot705 at the stages indicated at the top. Dorsal views; anterior to the top. The first and third rows show the merged images of wt1a:eGFP (eG; green) and fli1a:Myr-mCherry (mC; red) and those of fli1a:Myr-mCherry (mC; red) and Qdot705 (Qdot, cyan), respectively. The boxed areas on the images in the first and third rows are enlarged in the second and fourth rows, respectively. Qdot705 images in the boxed areas in the third row are enlarged in the bottom row. Arrows, Qdot705 circulating in the vessels surrounding the glomerular primordia; arrowheads, podocytes, or podocyte progenitors moving toward the midline; asterisks, Bowman’s space. Scale bars: 20 μm.

