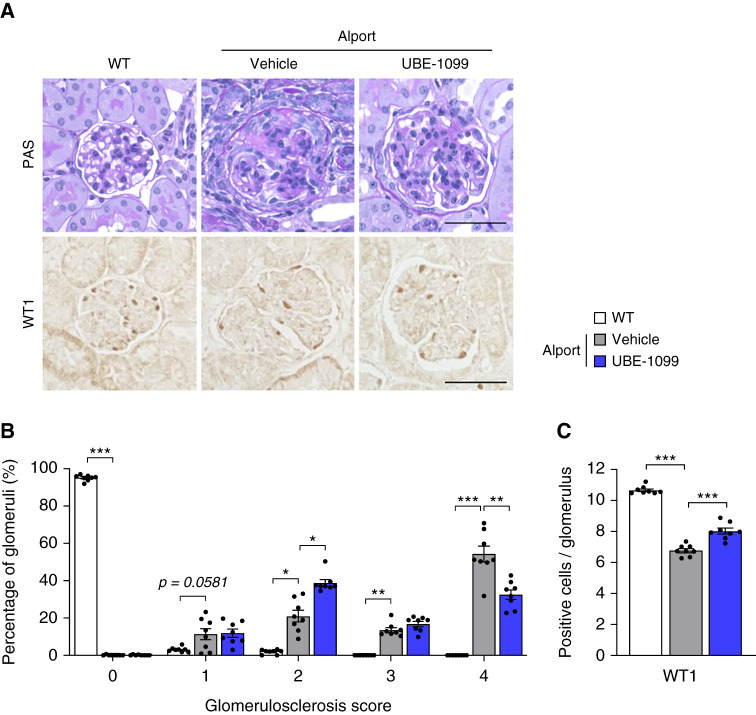
Figure 3.
UBE-1099 suppressed glomerulosclerosis in an Alport mouse model. (A) Renal sections of 22-week-old WT and Alport mice were analyzed by periodic acid–Schiff (PAS) staining and immunohistochemistry of Wilms’ tumor 1 (WT1). Representative images are shown. Scale bars: 50 μm. (B) Glomerulosclerosis scores were evaluated based on the PAS-stained sections. See Materials and Methods for assessment. (C) Quantification of WT1-positive cells in the glomerulus. Data are presented as the mean±SEM (n=8 per group). P values were assessed by Dunnett’s test. *P<0.05, **P<0.01, ***P<0.001.

