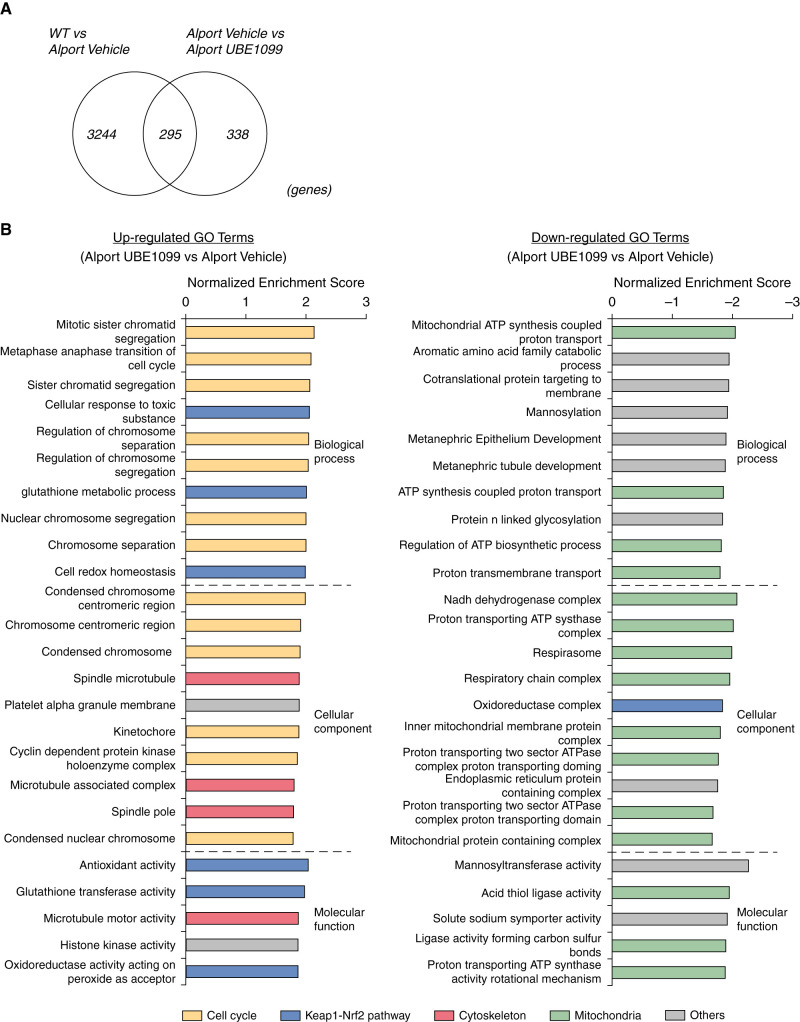
Figure 6.
Transcriptome analysis reveals the comprehensive effects of UBE-1099 in the glomeruli of an Alport mouse model. (A) Venn diagram shows the number of fluctuated genes in three comparisons (WT versus Alport vehicle, Alport vehicle versus Alport UBE-1099; fold change >1.2 or <–1.2, P<0.05). (B) Gene ontology (GO) analysis of the differentially expressed genes in UBE-1099-treated Alport mice versus Alport vehicle analyzed using Gene Set Enrichment analysis software (v4.10). Colored graphs represent the terms as indicated. P<0.01.

