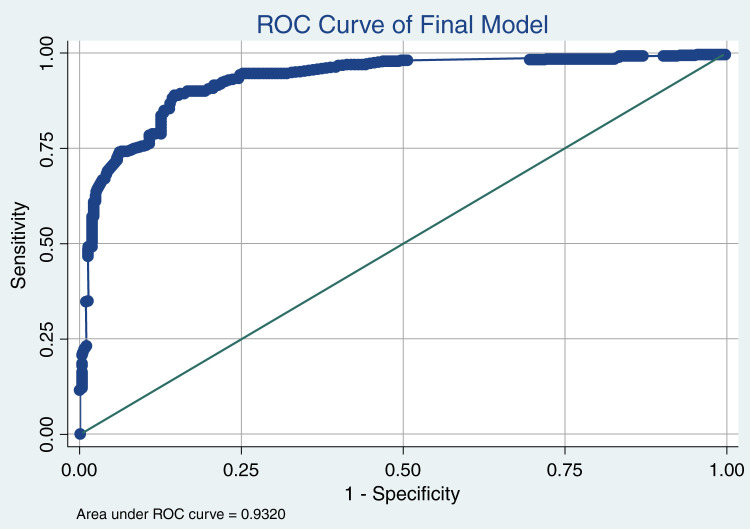
Figure 1.
Receiver operating characteristic (ROC) curve for final model with the y axis representing sensitivity and x axis showing 1−specificity. The sensitivity of model is 90%, specificity 81%, positive likelihood ratio 4.86, negative likelihood ratio 0.12, positive predictive value 89%, and negative predictive value 84%.

