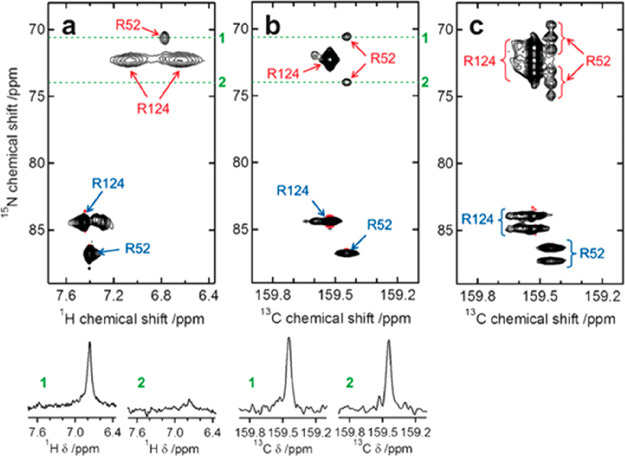
Figure 11.
(a) 1H-15N HSQC spectrum of 1 mM PYP in 5 mM potassium phosphate at pH 6.2. The 15Nη–1Hη and 15Nϵ–1Hϵ correlations are indicated in red and blue, respectively. (b) 1H-decoupled and (c) 1H-coupled 15Nη/ϵ–13Cζ correlation spectra of 3 mM PYP in 5 mM potassium phosphate at pH 6.5. The 15Nη–13Cζ and 15Nϵ–13Cζ correlations are indicated in red and blue, respectively. To avoid additional signals due to the presence of 2H isotopomers, D2O for field lock was added externally to a separate compartment of the NMR tube. The number of scans is as follows: (a) 16, (b) 128, and (c) 192. In (a) and (b), 1D traces from the 2D spectra, indicated by the broken lines, are shown. Reproduced with permission from ref (31). Copyright 2017 Wiley-VCH Verlag GmbH and Co. KGaA, Weinheim.

