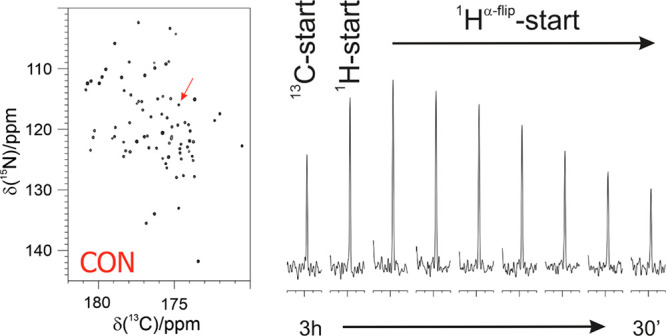
Figure 2.

Intensity of one of the cross peaks obtained in 2D CON experiments (the correlation for C′59–N60 of ubiquitin indicated by an arrow in the full spectrum reported on the left) recorded with different pulse schemes and different interscan delays (d1) is compared by showing its trace. From left to right: 13C-start (relaxation delay d1 = 2.5 s), 1H-start (d1 = 1.5 s), and 1Hα-flip with different d1 (1.5, 1.2, 0.9, 0.7, 0.5, 0.35, 0.2 s). Adapted from ref (59). Copyright 2009 American Chemical Society.
