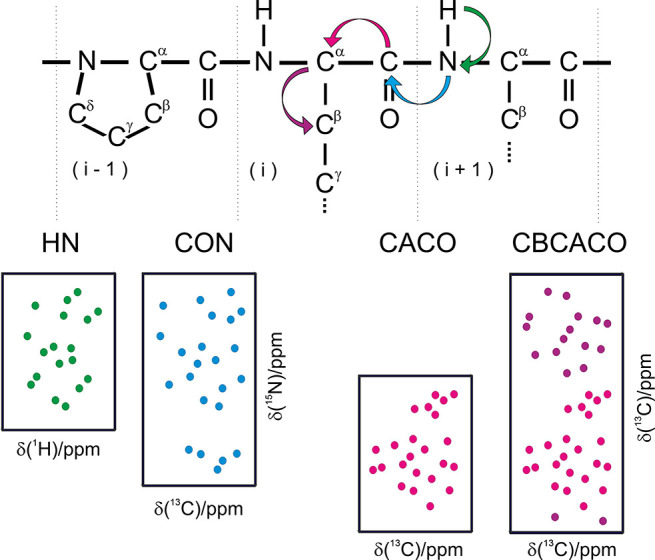
Figure 6.

Schematic representation of the 2D spectra based on 13C direct detection that can be used, in conjunction with the 2D HN (1H–15N HSQC), to obtain a fingerprint of a protein. These include the 2D CON (13C′–15N correlation), 2D CACO (13C′–13Cα correlation), 2D CBCACO (13C′–13Cα and 13C′–13Cβ correlations) spectra. The scalar couplings exploited to detect the correlations in the various spectra are schematically indicated in the top panel (1JNH, 1JC′N, 1JC′Cα, 1JCαCβ). In addition to the correlations involving backbone nuclei shown in the figure, correlations involving specific side-chains can be observed (for Asn and Gln in HN and CON 2D spectra and for Asn/Asp and Gln/Glu in CACO and CBCACO 2D spectra). Adapted from ref (112). Copyright 2014, Nature Publishing Group, a division of Macmillan Publishers Limited. All Rights Reserved.
