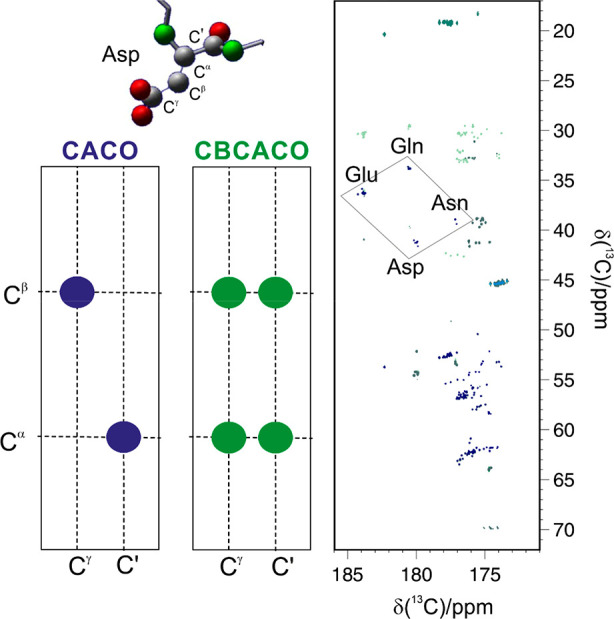
Figure 9.

Superposition of the CACO (blue contours) and the CBCACO (green contours) spectra recorded on a 600 μM sample of α-synuclein in 20 mM Tris-Cl buffer, pH 7.4, and 310 K at 16.4 T. On the left, the correlations observable in the two spectra for an Asp residue, sketched above, are schematically reported.
