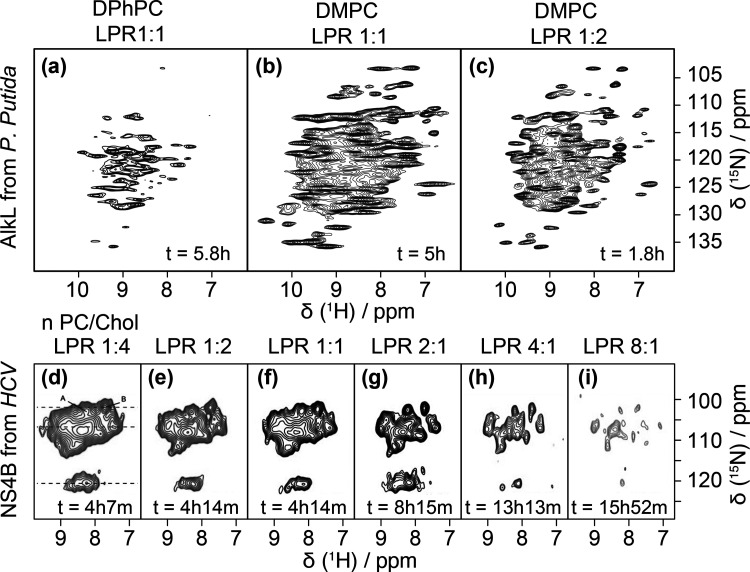
Figure 17.
Top: Sample optimization of 15N-labeled AlkL in lipid bilayers of different compositions. (a) DPhPC, protein-to-lipid ratio 1:1, (b) DMPC, protein-to-lipid ratio 1:1 recorded on a 800 MHz spectrometer at 60 kHz MAS, (c) DMPC, protein-to-lipid ratio 2:1, recorded on a 1000 MHz spectrometer at 111 kHz MAS. Reproduced with permission from ref (12). Copyright 2018 Elsevier. Bottom: Spectral resolution as a function of LPR. Two-dimensional 1H,15N correlation spectra of Gly- and Tyr-labeled NS4B reconstituted into PC/Chol liposomes at LPRs from 0.25 to 8 acquired at ωH = 850 MHz and 80 kHz (d–g) or 90 kHz (h,i) MAS. Reproduced with permission from ref (108). Copyright 2020 John Wiley & Sons.

