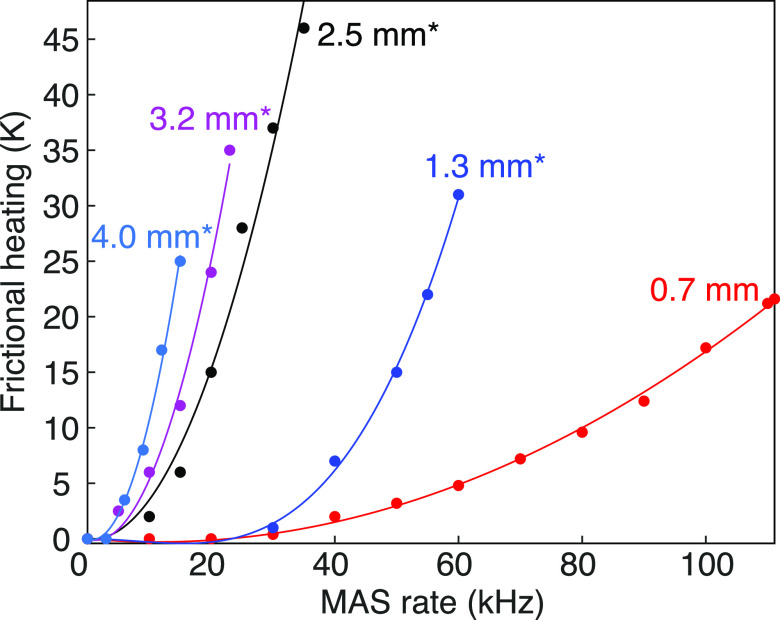
Figure 19.
Frictional heating induced by MAS rotors of different sizes in dependence of their spinning frequency. Parabolic fit curves are plotted as lines. Asterisks label the experimental datasets, determined by monitoring the chemical shift of lead chloride. Data points for the 0.7 mm probe are inferred from the 79Br chemical shift of KBr following the procedure described in ref (135). In this experiment, the variable-temperature gas flow was set to 1200 L/h and regulated at 293 K. Adapted with permission from ref (134). Copyright 2017 Elsevier.

