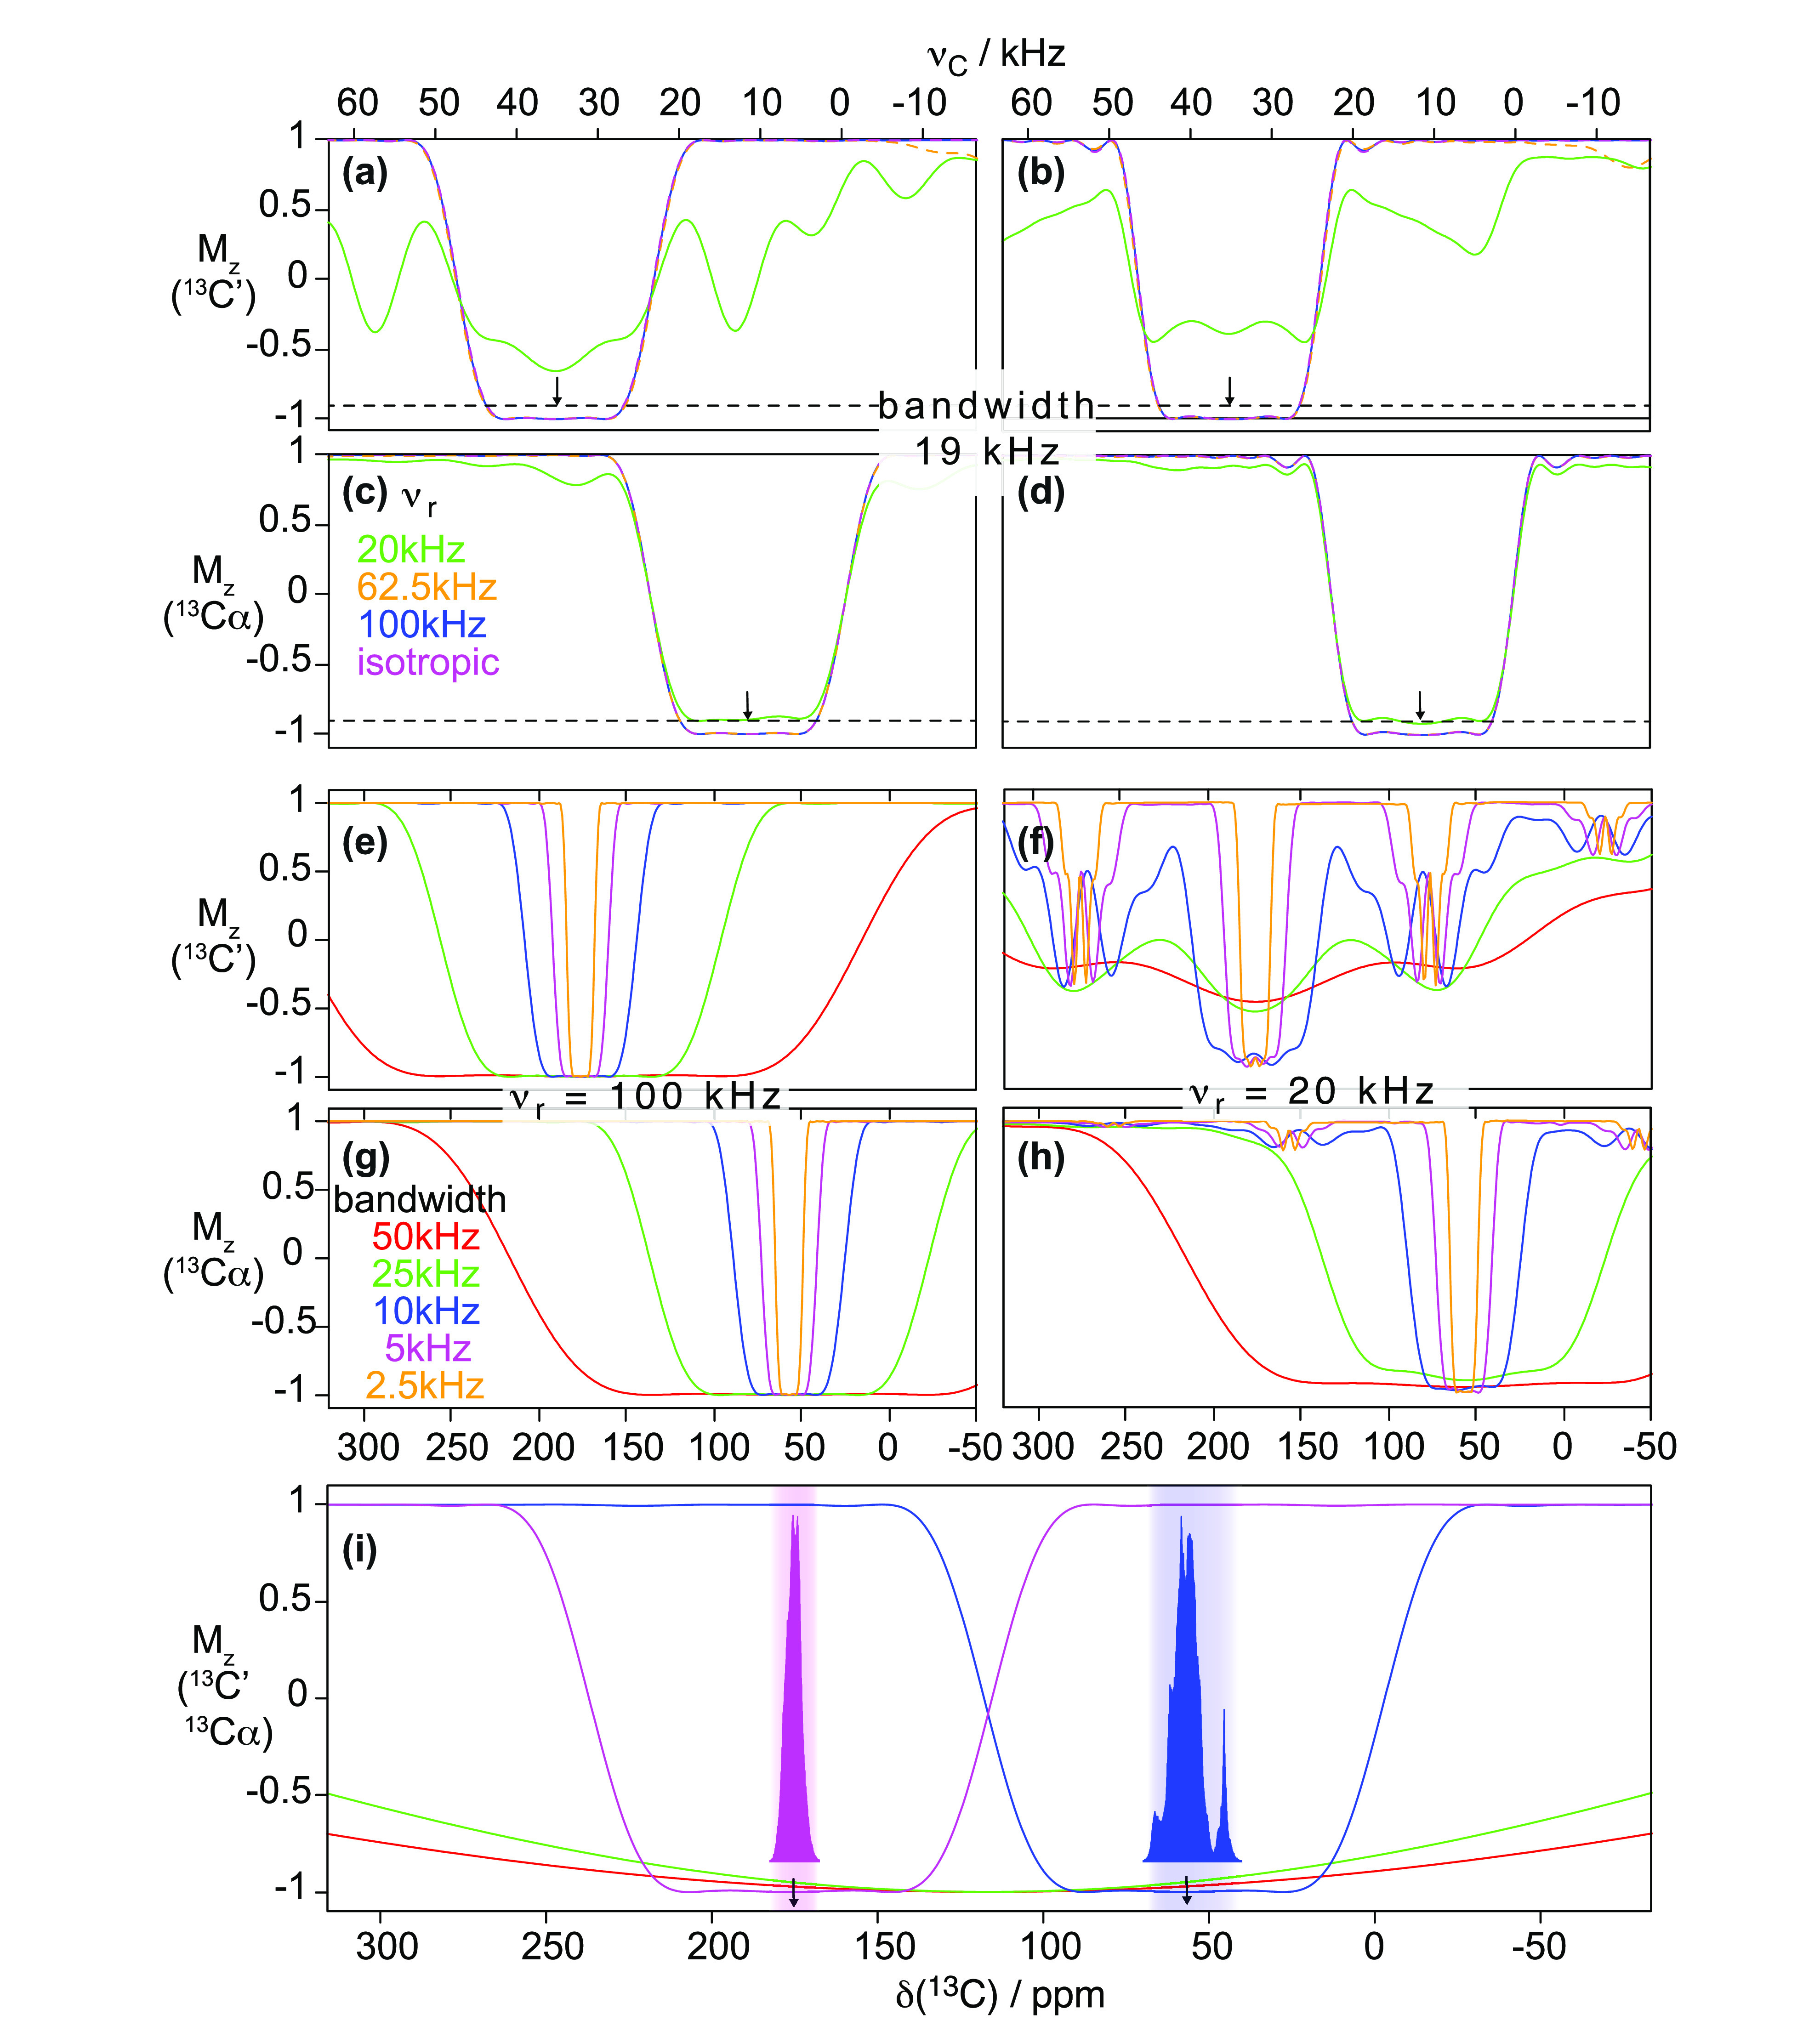
Figure 28.

Inversion profiles of Q3 (a,c,e–h) and ReBURP (b,d) pulses acting on (a,b,e,f) 13C′ and (c,d,g,h) 13Cα spins in a three-spin system (including additionally a 13Cβ spin), simulated using SIMPSON. Simulations were performed for spinning frequencies of 20, 62.5, and 100 kHz and are color coded in (a–d) with green, orange, and blue curves, respectively. Additionally, an isotropic case was emulated by preserving only isotropic chemical shifts, and the corresponding curve (magenta) virtually superimposes with the case of 100 kHz MAS. The duration of Q3 and ReBURP pulses were set to, respectively, 179.6 and 244.2 μs to ensure an identical nominal bandwidth of 19 kHz (95 ppm for 13C at 18.8 T). (e–h) Inversion profiles of Q3 pulses with duration and RF amplitude varied accordingly to yield a nominal bandwidth of 50, 25, 10, 5, and 2.5 kHz are shown as red, green, blue, magenta, and orange curves, respectively. In simulations, MAS frequency was set to (e,g) 100 and (f,h) 20 kHz. (i) Inversion profiles of two independent Q3 pulses applied at the centers of a chemical shift band of 13C′ (176 ppm, magenta) and 13Cα (56 ppm, blue), superimposed with inversion profiles of rectangular π pulses of RF amplitude ν1C = 100 (red curve) and 75 kHz (in green) applied at the offset between 13C′ and 13Cα. Typical ranges of 13C′ and 13Cα chemical shifts are indicated. In (i), a spinning frequency of 100 kHz was assumed. In all simulations, the following spin system parameters were set: (δiso, δaniso, η) = 175.0 ppm, 124.3 ppm, 0.99 (for 13C′); 6.8 ppm, −30 ppm, 0.89 (for 13Cα); 40.6 ppm, 25.9 ppm, 0.98 (for 13Cβ); D(13C′–13Cα) = 2180 Hz, J(13C′–13Cα) = 50 Hz, D(13Cα–13Cβ) = 2085 Hz, J(13Cα–13Cβ) = 33 Hz, D(13C′–13Cβ) = 502 Hz, J(13C′–13Cβ) = 3 Hz; 1 ppm of 13C corresponds approximately to 200 Hz at assumed B0 field of 18.8 T.
