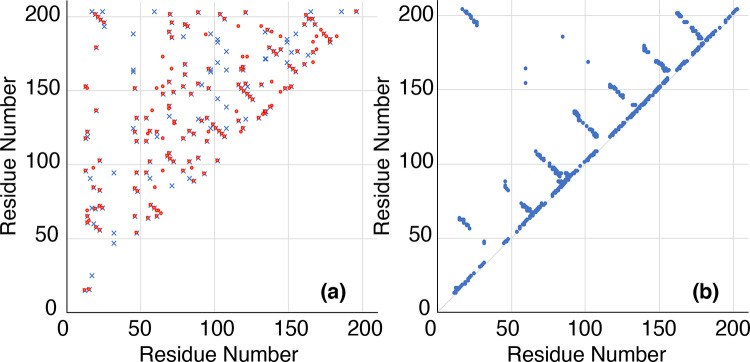
Figure 51.
Proton–proton contact maps measured for AlkL. In (a), automatically generated contacts from peaks picked from the (H)NH(H)NH spectra. Contacts arising from one side of the spectrum diagonal are shown in red, whereas those from the other are shown in blue. In (b), the contact map of the final structure is shown, after resolution of ambiguities using CYANA, and including contacts from all spectra. Adapted with permission from ref (60). Copyright 2020 National Academy of Sciences of the USA.

