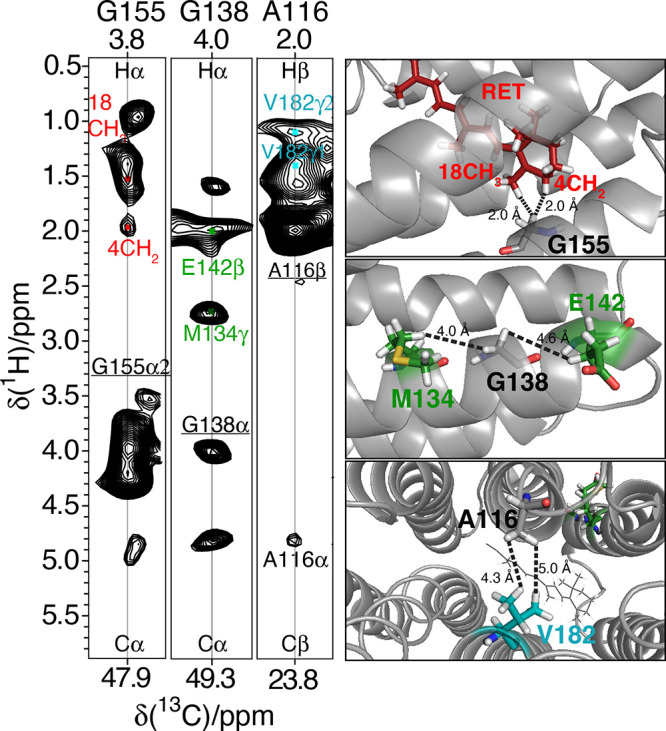
Figure 59.

2D cross sections (left) of a 3D H(H)CH-RFDR spectrum acquired on U-[15N, 13C] proteorhodopsin in lipids at 100 kHz MAS at 305 K and 23.5 T, with 1H–1H correlations assigned to intra/interhelical and helix-retinal contact cofactor, as depicted in the schematic 3D structure of the protein (right). Reprinted from ref (228). Copyright 2017 American Chemical Society.
