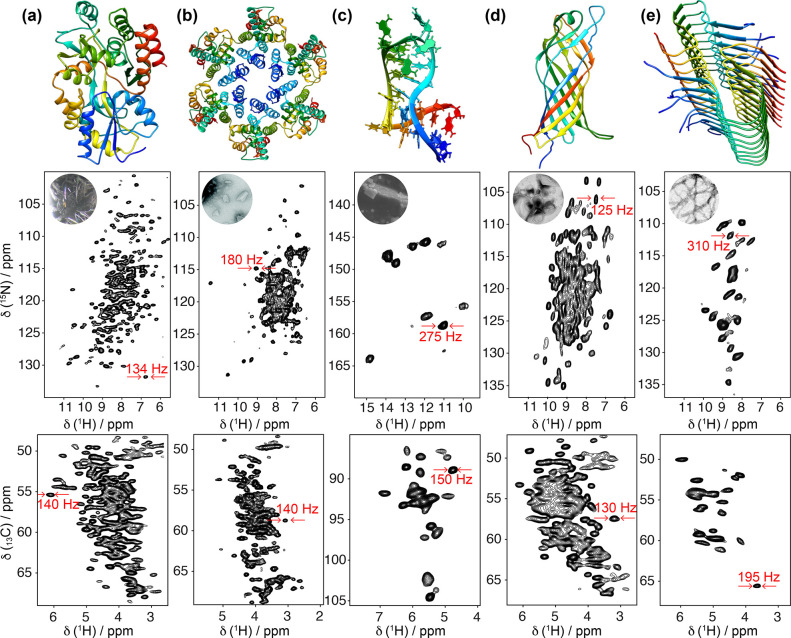
Figure 6.
2D 1H–15N (top) and 1H–13C (bottom) correlation spectra acquired at 100 kHz MAS frequency for (a) microcrystalline maltose binding protein,57 (b) tubular HIV-1 capsid protein assemblies,58 (c) 26mer box C/D RNA bound to the L7Ae protein,59 (d) membrane protein AlkL,60 and (e) fibrils of Aβ42.61 Displayed regions correspond to amide and α sites (a,b,d,e) and imino N–H and ribose C1′–H1′ and U/C C5–H5 moieties (c). The corresponding structures (PDB codes 1ANF, 6WAP, 2N0R, 6QWR, 5KK3) are displayed on top of each pair of spectra.

