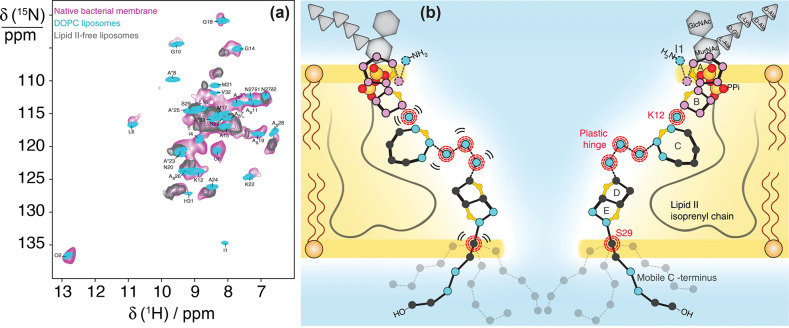
Figure 68.
Lipid II–nisin complex in cellular membranes. (a) Comparison of 1H-detected 2D 1H–15N spectra of lipid II-bound nisin in native M. flavus membranes (magenta) and in DOPC (cyan). The gray spectrum shows nisin nonspecifically bound to DOPG/DOPC liposomes (7:3 ratio) in the absence of lipid II. (b) Membrane arrangement of the nisin/lipid II topology as seen by MAS NMR. Plastic residues that are required to adapt to the bacterial target membrane are highlighted with red circles. Residues that showed 1H/2H exchange are colored in blue and align the pore lumen. The C-terminus is dynamically disordered and resides at the water–membrane interface. Reprinted with permission from ref (397). Copyright 2018 Springer Nature.

