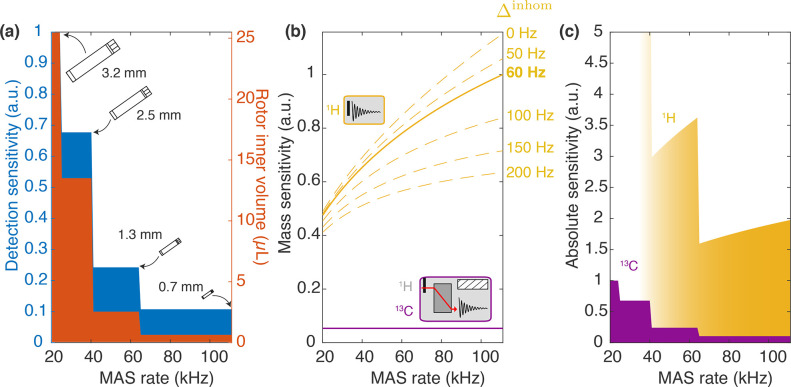
Figure 9.
Detection sensitivity as the function of MAS frequency (thus also rotor size) for 13C and 1H nuclei. (a) Rotor inner volume for different commercial rotors (Bruker 3.2, 2.5, 1.3, and 0.7 mm) is depicted an orange area. The detection sensitivity of the probe, calculated as the product of the sample volume and the inverse of the rotor diameter, is shown in blue in the same plot. Values are normalized to the detection sensitivity of a Bruker 3.2 mm probe. (b) Mass sensitivity of a direct proton 1D experiment (yellow) as compared to 13C-detected 1D CP (purple) versus MAS. CP efficiency of 50% was assumed. Increasing MAS reduces homogeneous contribution to 1H linewidths, which in turn translates into better sensitivity. Simulations are performed for different inhomogeneous contributions to the lines (from 0 to 200 Hz, dashed lines) and calculated values for microcrystalline GB1 correspond to the solid line (60 Hz inhomogeneous linewidth). 13C LW are supposed to be identical in the whole MAS range, corresponding to constant mass sensitivity. Values are normalized to 1H detection at 111 kHz MAS (with Δinhom = 60 Hz). (c) Product of the probe detection sensitivity and the mass sensitivity is given as the absolute sensitivity of 1H detection (yellow) and 13C detection (purple). Values are normalized to 13C detection at 20 kHz MAS.

