Figure 4.
TRIM5 is required for mitophagy in response to mitochondrial depolarization
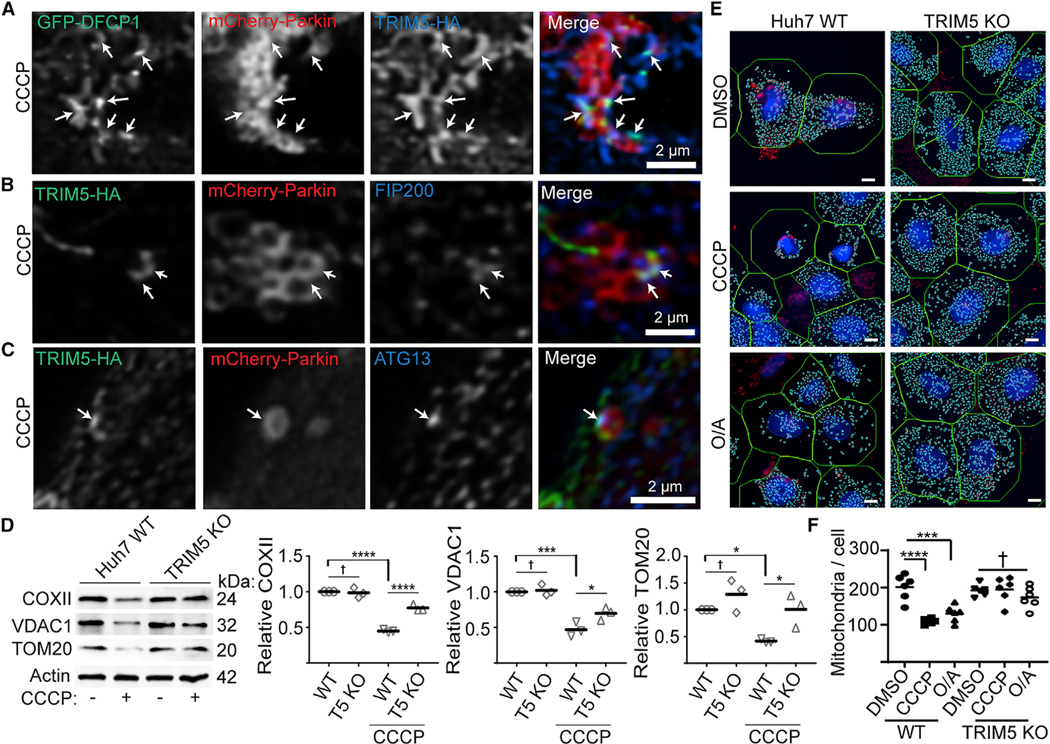
(A) HeLa cells stably expressing TRIM5-HA (blue) were transiently transfected with both mCherry-Parkin (red) and eGFP-DFCP1 (green) prior to 2 h CCCP treatment and confocal microscopy. Arrows indicate regions of TRIM5/DFCP1 colocalization that are associated with Parkin-labeled mitochondria.
(B and C) Representative confocal images of cells treated as above and stained to detect TRIM5-HA (green), mCherry-Parkin (red), and the autophagy factors FIP200 (B) or ATG13 (C) (blue). Arrows indicate foci of colocalized green and blue signals on the outside of Parkin-decorated mitochondria.
(D) Immunoblot-based analysis of mitochondrial-protein abundance in lysates from WT and TRIM5 knockout Huh7 cells under basal conditions and following 24 h treatment with CCCP. The abundance of these proteins from three independent experiments are plotted relative to actin.
(E and F) High-content-imaging-based analysis of the abundance of mitochondrial nucleoids in WT and TRIM5 KO Huh7 cells treated with CCCP (10 μM) or oli-gomycin and antimycin (O/A; 10 and 5 μM, respectively) for 24 h prior to fixation and staining with an antibody that preferentially recognized mitochondrial DNA (red) and nuclear staining (blue). Left: representative images showing automatically defined nuclear and cell boundaries (blue and green rings, respectively) and mitochondrial nucleoids (aqua mask). The number of mitochondria per cell was determined for 2,000 cells per experiment. n = 6 biological replicates. Scale bar, 10 mm. Data: mean + SEM; p values determined by ANOVA; *p < 0.05, ***p < 0.001, ****p < 0.0001; †, not significant.

