Figure 5.
TRIM5 recruits upstream autophagy regulatory machinery to damaged mitochondria
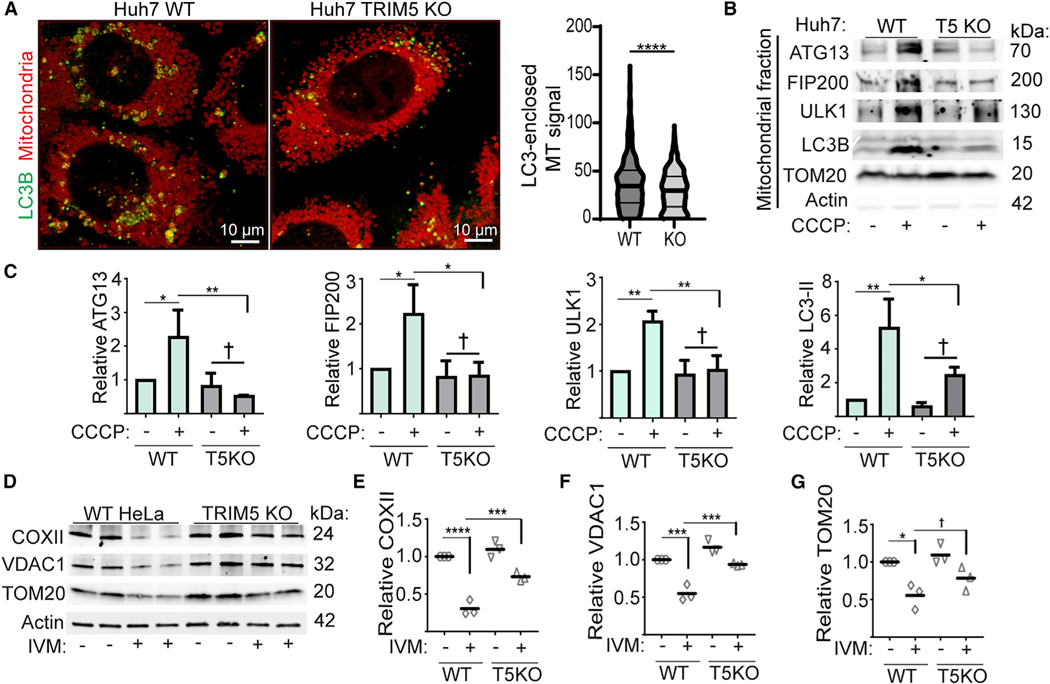
(A) Left: confocal microscopic analysis of WT and TRIM5 KO Huh7 cells 6 h after CCCP treatment stained to detect LC3B and mitochondria. 3D reconstructions of deconvolved images were generated, and the intensity of mitochondrial signal within LC3-positive structures was quantified relative to the volume of the LC3 structure and plotted as shown on the right. n > 700 LC3 positive structures. Data: median and quartiles shown; ****, p < 0.0001 by Mann-Whitney.
(B and C) Recruitment of autophagy machinery to mitochondria following CCCP treatment. Lysates from mitochondria purified from WT or TRIM5 Huh7 cells treated with CCCP (20 mM) or vehicle control (DMSO) for 6 h were subjected to immunoblotting with the indicated antibodies. Plots show the abundance of the indicated proteins in the mitochondrial fractions relative to TOM20. n = 3 biological replicates.
(D–G) Immunoblot analysis of the effect of TRIM5 knockout on ivermectin-stimulated degradation of COXII, VDAC1, and TOM20 in HeLa cells. Cells were treated or not with ivermectin (15 μM) for 24 h prior to lysis and immunoblotting. The abundance of the proteins indicated in the graphs was determined relative to actin. n = 3 biological replicates. Data: mean + SEM by ANOVA, *, p < 0.05; **, p < 0.01; ***, p < 0.001; ****, p < 0.0001, †, not significant.

