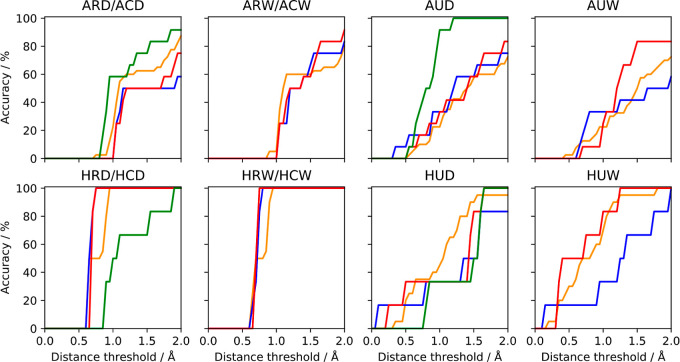
Figure 7.
Percentage of the crystallographic waters identified for both apo- (top row) and holo-ferritin (bottom row) using each simulation type at a range of distance thresholds. For each simulation type, the mean accuracy and associated standard error (over all independent repeats) was assessed by comparing the clusters (with occupancies greater than 30%) with the experimental water sites using a range of distances between 0.0 and 2.0 Å. The color code is as follows: orange: NPT (AMBER), blue: NVT (OpenMM), red: μVT (OpenMM), and green: μVT (ProtoMS).

