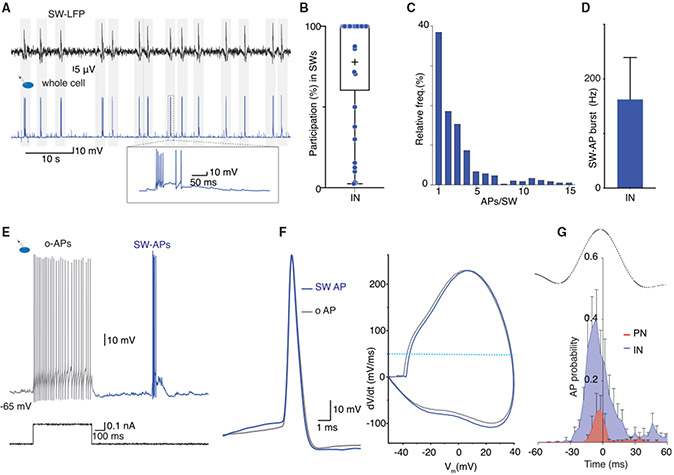
Figure 5. Interneurons are driven orthodromically and discharge a burst of action potentials during sharp waves.
(A) Simultaneous recording of LFP SWs (top) and whole-cell recording in an IN shows AP discharge with every SW. Inset: expanded trace of a SWi-EPSP with AP burst.
(B) Participation of INs with AP discharge during SWs. Each dot shows participation rate with discharge during the SW from individual INs (n = 37); +, the mean participation rate.
(C) Bar graph plotting the number of APs fired by individual INs in each SW (n = 2,827 episodes).
(D) Burst frequency of IN discharge during SWs (mean ± SD).
(E and F) SW-APs in INs are evoked by orthodromic excitation. (E) Current clamp recording in an IN showing response to depolarizing current injection step evoked o-APs (gray) and a spontaneously occurring SW-AP burst (blue). (F) Left, superimposed traces of the first SW-AP (blue) and the first o-AP (gray) in the same IN illustrating similar waveforms. Right, superimposed phase plot of the SW-AP and the o-AP. The horizontal dotted line marks AP threshold, defined as dV/dt = 50 mV/ms.
(G) Distribution shows AP discharge probability for PNs (red, n = 5) and INs (blue, n = 8) with respect to the peak of simultaneously recorded SW (LFP) (black trace). Error bars: SEM. INs discharge early in the rising phase and continue throughout the SW. PNs are engaged sparsely and mostly do not discharge after the SW peak.

