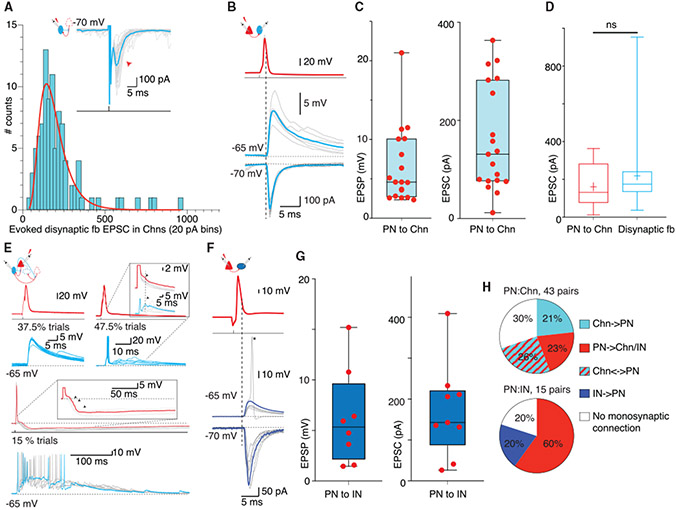
Figure 6. Local glutamatergic connections drive feedforward INs in sharp-wave bursts.
(A) Schematic of Chn disynaptic feedback circuit and trace show voltage-clamp recording from a representative Chn. A brief voltage step (70 mV, 0.5 ms) evoked a feedback EPSC (mean in cyan overlaid on individual trials). Histogram shows distribution of mean amplitude of disynaptic feedback EPSCs (n = 96) fitted with a logarithmic curve (red).
(B) Paired recording from a PN (red) and a Chn (blue). Top, superimposed traces show an AP evoked by current injection (2.5 nA, 1 ms) in the PN evoked a monosynaptic EPSP (current clamp, middle) and large EPSCs (voltage clamp, bottom trace) in the Chn; mean trace in color overlaid on individual trials. The dotted line marks the peak of the AP.
(C) Panels show amplitude of a pre-PN AP evoked monosynaptic EPSPs and EPSCs in Chns. Each dot represents the mean amplitude recorded in individual pairs.
(D) PN-evoked monosynaptic EPSCs in Chn re comparable to the evoked disynaptic feedback EPSC. Comparison of evoked monosynaptic EPSCs (n = 19, 161 ± 108 pA) and di-ynaptic feedback EPSCs in Chns (n = 96, 218 ± 158 pA, KS test, p = 0.07).
(E) Feedforward circuits between PNs and Chns. Paired recording from a PN (red) and Chn (blue). Top left, current injection (2.5 nA for 1 ms) evoked an AP in the PN and monosynaptic EPSP in the Chn (bottom, cyan). Top right, traces from the same pair showing trials when the PN input triggered discharge in the Chn that was followed by feedback EPSP. Inset shows enlarged traces from the PN and Chn, with feedforward IPSP (arrow) in the PN, simultaneously with feedback EPSP in the Chn (dotted line). Bottom, traces from the same pair on a compressed timescale showing trials when the PN input triggered an AP in the Chn. The feedback EPSP triggers an AP burst and a summating IPSP in the PN. Individual trials in gray and a single trial highlighted in color. Inset, enlarged traces of the PN membrane potential showing burst of IPSPs (arrow).
(F) PNs provide large inputs to INs without feedback excitation (non-Chn). Paired recording of PN (red) and non-Chn (blue). Current injection (2.5 nA for 1 ms) in the PN evoked an AP and monosynaptic EPSP (middle, current clamp) or EPSC (bottom, current clamp) in the IN. In some trials, the PN input evoked an AP in the IN (17% of trials). Note the lack of feedback EPSP in this IN.
(G) Mean amplitude of evoked EPSPs and EPSCs in non-Chns. Each dot represents the mean amplitude from individual pairs.
(H) Pie charts show proportions of synaptic connectivity between PN-Chn (top) and PN-IN pairs (bottom).

