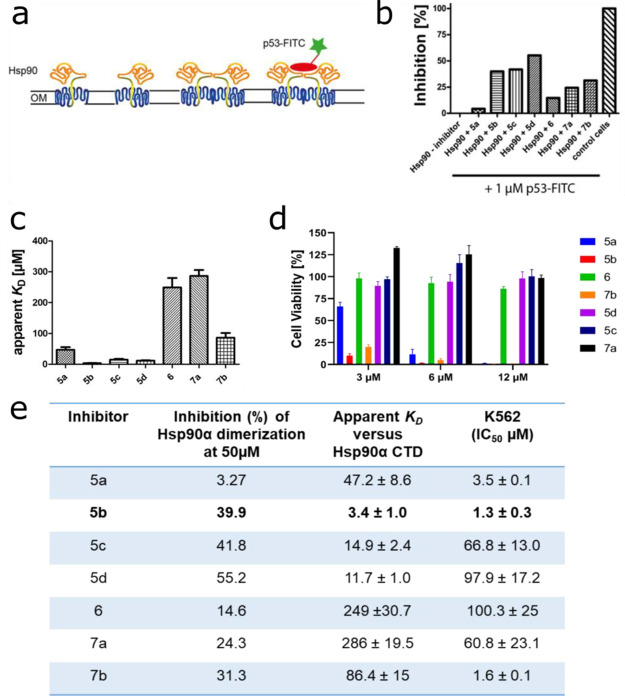
Figure 2.
Selection of 5b as a lead candidate. (a) Schematic view of the Hsp90 dimerization assay using Autodisplay. (b) Flow cytometry measurements of the inhibition of dimerized Hsp90α displayed on E. coli cells.36E. coli BL21 (DE3) cells displaying Hsp90α incubated with 1 μM FITC-labeled p53 lead to a high cellular fluorescence indicating dimerization of Hsp90α. The value obtained was set as 0% inhibition. In contrast, E. coli cells without displaying Hsp90α (control cells) show no cellular fluorescence. The value obtained here was set as 100% inhibition. Preincubation of E. coli cells with surface-displayed Hsp90α with 50 μM of the respective substance leads to a lowered cellular fluorescence intensity indicating a lowered binding affinity of FITC-labeled p53 to surface-displayed Hsp90α. These values were set in relation to obtain the relative inhibition of dimerization. (c) Apparent KD values of the purified CTD of Hsp90α and the respective substance measured via the MST method. A constant amount of 50 nM labeled CTD of Hsp90 was used, and three independent measurements were performed. The resulting mean values were determined and used in the KD fit formula. (d) Cellular viability assessment of a leukemic cell line (K562) measured by incubating with the indicated inhibitors for 72 h, followed by a viability measurement using an ATP-based Celltiter Glo assay. (e) Selection of 5b as a lead candidate on the basis of high inhibition of Hsp90α dimerization, low apparent KD, and low IC50 (μM) in a tested leukemic cell line.

