Figure 3.
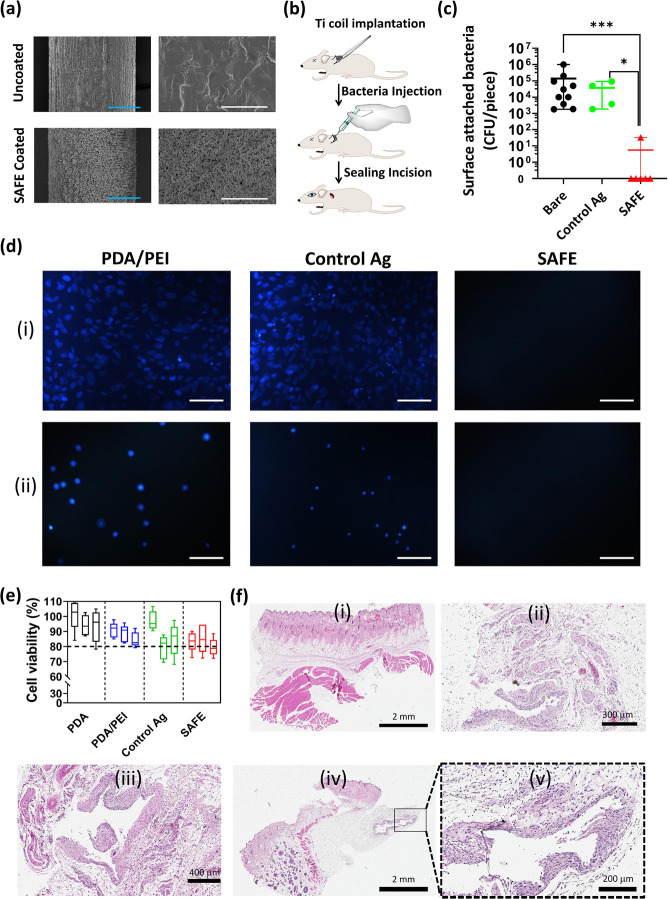
In vivo activity and biocompatibility of SAFE coating. (a) SEM images of the uncoated Ti wire and the SAFE-coated Ti wire at two different magnifications including 0.35 k (left) and 5 k (right). The blue and white scale bars are 100 and 10 μm, respectively. (b) Cartoon showing the insertion of the Ti implant under the skin on the back of the rat in the subcutaneous pocket. (c) Number of bacterial colonies attached to the surface of uncoated (n = 9), “control Ag” (n = 4), and SAFE coated (n = 6) Ti implants after 7 days of implantation in the subcutaneous pockets of rats. * indicates a P value ≤0.05, ** indicates a P value ≤0.01, and *** indicates a P value ≤0.001. (d) Fluorescence microscopy images of cell adhesion on the surface of the “control Ag” coating and the SAFE coating following 24 h incubation with (i) fibroblast and (ii) bladder cells (T24) at 37 °C. (e) Viability (%) of cells (T24 bladder cells) grown for 24 h in the media (RPMI, 10% FBS, 1% penicillin/streptomycin) incubated with different coatings, including PDA, PDA/PEI, “control Ag” and SAFE coatings (n = 5) at 12 h (left box), 24 h (middle box), and 48 h (right box). (f) Optical microscopy images of the H&E-stained section of (i) healthy skin tissue and skin tissues in vicinity of the (ii) uncoated Ti implant, (iii) “control Ag”-coated Ti implant, and (iv, v) SAFE-coated Ti implant.

