
Figure 4: Differentiation of SC-TOs into specialized 3D EVT organoids (SC-EVTOs).
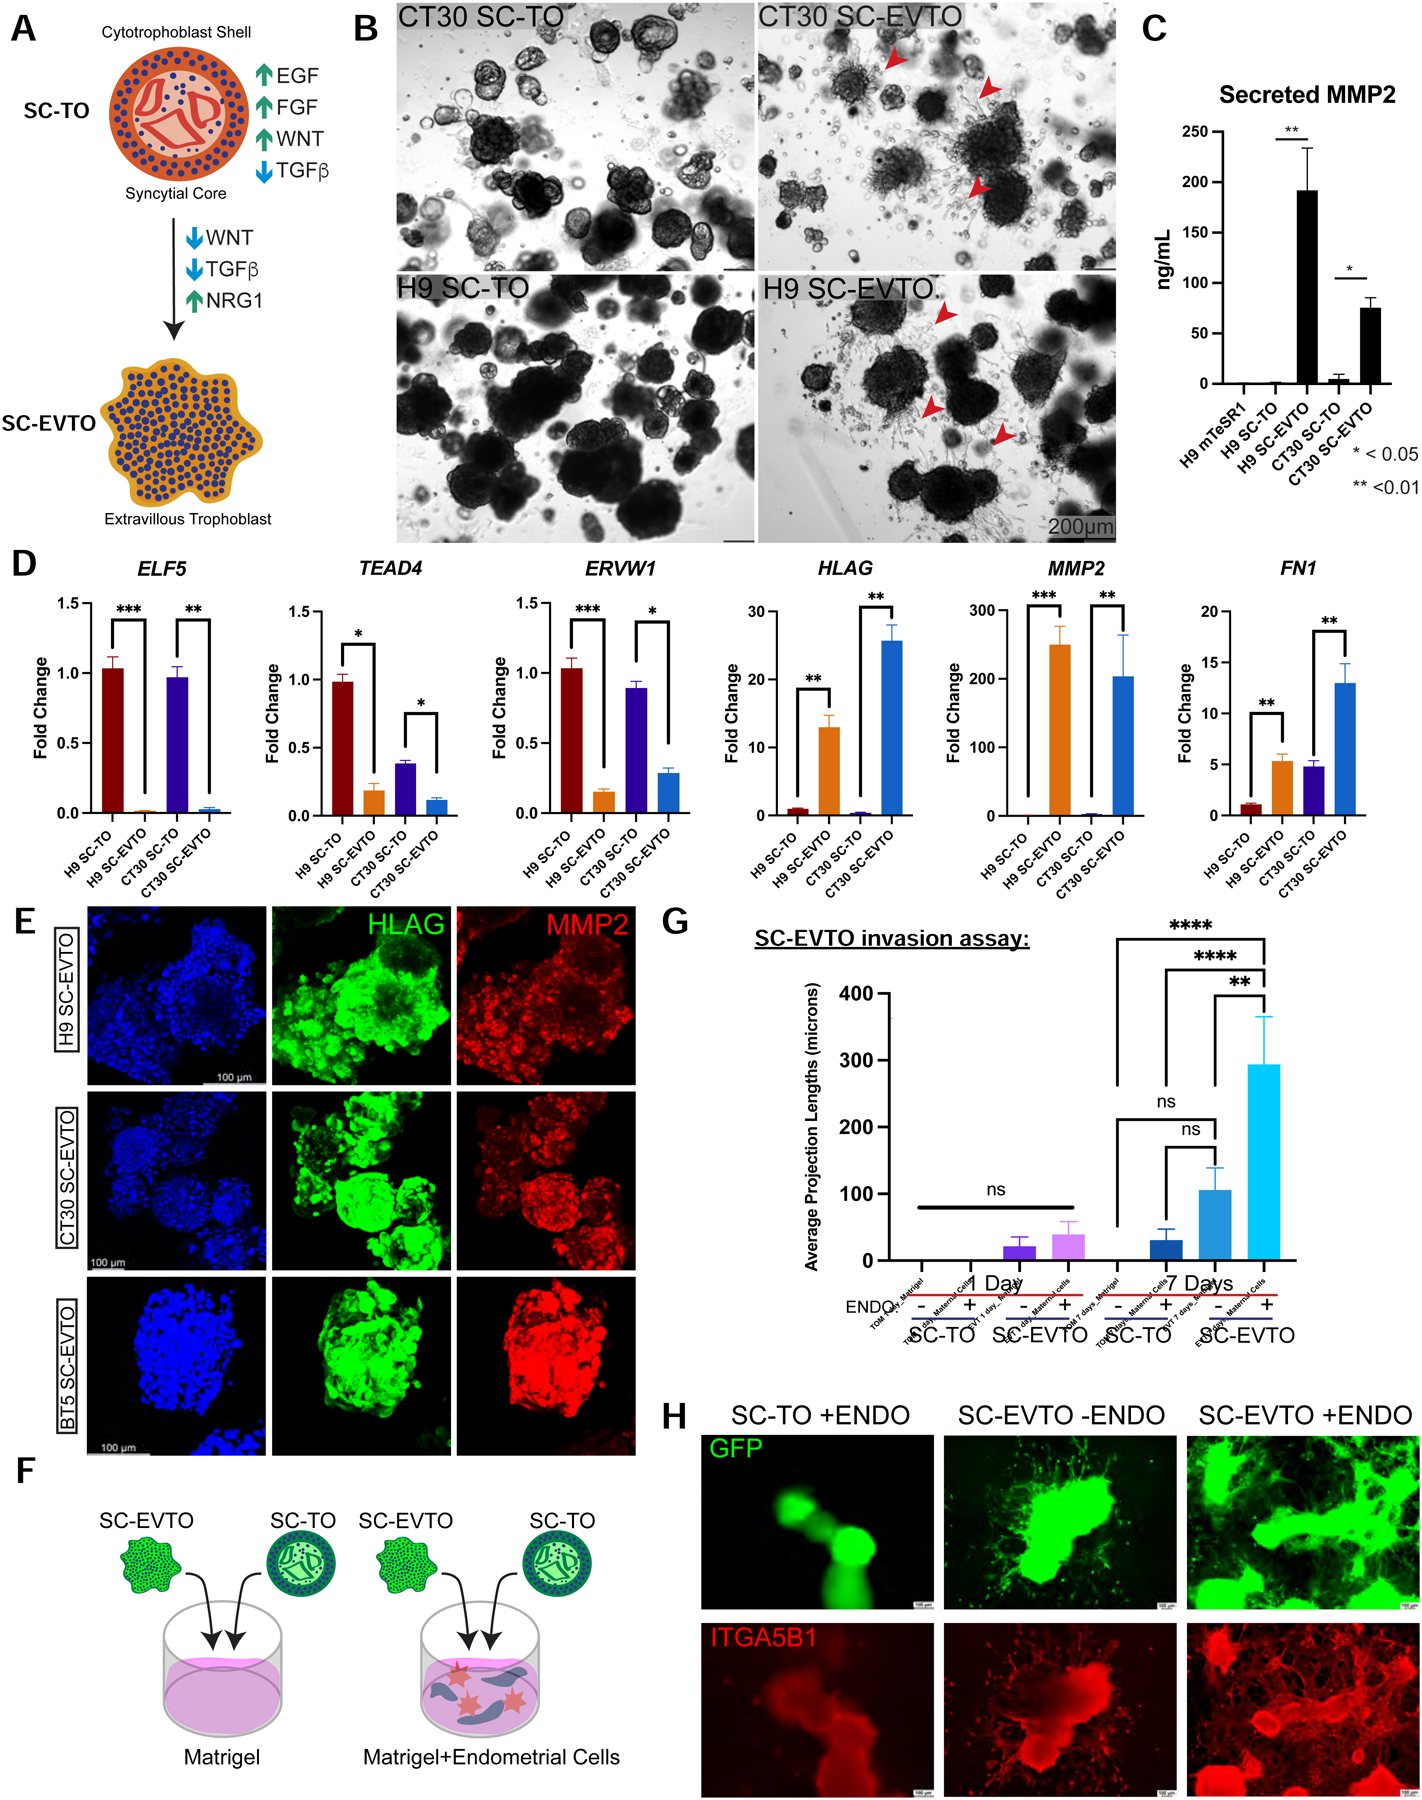
A. Schematic representation of signaling requirements to maintain SC-TOs or induce differentiation towards specialized 3D SC-EVTOs.
B. Phase contrast view of SC-TOs maintained in trophoblast organoid medium (TOM) (Turco et al., 2018), which promotes a smooth and spherical structure. Both CT30 and H9 SC-TOs differentiated into 3D SC-EVTOs exhibit migratory EVTs, as indicated by red arrows. The scale bar depicts 200 μm.
C. ELISA analysis of secreted MMP2 from SC-TO lines exposed to EVT-promoting media. These studies represent two biological replicate experiments (H9 and CT30 SC-TOs). Error bars indicate mean ± 1 SE of three technical replicates. *p-value<0.05; **p-value<0.01.
D. Quantitative gene expression analysis of general trophoblast markers ELF5 and TEAD4, the STB differentiation marker ERVW1, and EVT differentiation markers HLAG, MMP2, and FN1 upon differentiation of H9 and CT30 SC-TOs into SC-EVTOs. Fold change is plotted relative to H9 SC-TO. Error bars indicate mean ± 1 SD of 2–3 biological replicates.
E. Maximal projection images of SC-EVTOs demonstrate overlapping HLAG and MMP2 expression. These data represent differentiation experiments performed with three independent SC-TO lines (H9, CT30, and BT5).
F. Schematic of the SC-TO/SC-EVTO invasion assay to test interactions with immortalized human endometrial fibroblasts and glandular epithelial cells embedded in a 3D Matrigel matrix. H9 SC-TOs were lentivirally labeled with a constitutive GFP vector to enable quantification of invasive projections.
G. Quantification of SC-TO/SC-EVTO invasive projections between days 1 and 7 of co-culture with or without human endometrial cells.
H. Representative images of SC-TO/SC-EVTO invasion assay in the presence (+ENDO) or absence (−ENDO) of human endometrial cells. The most pronounced invasive projections were observed using SC-EVTOs in the presence of endometrial cells. GFP constitutively marks SC-TOs/SC-EVTOs. ITGA5B1 staining indicates invasive EVTs. Scale bar = 100μm.
See also Supplemental Movies 1 and 2 and Table S3.