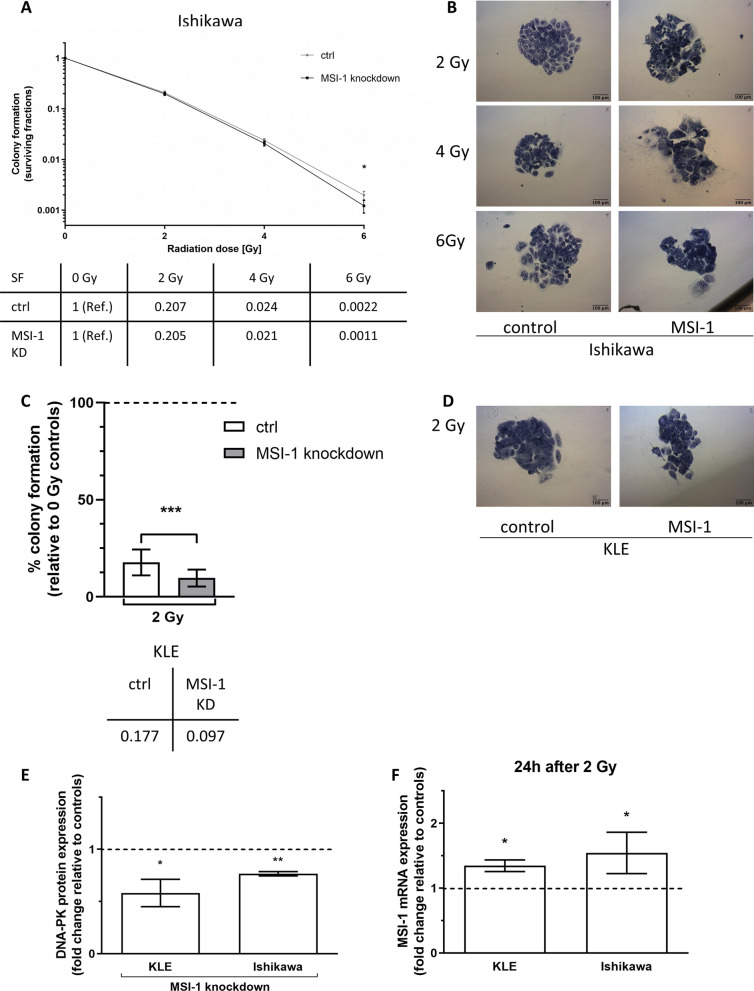
Fig. 4.
Radioresistance and DNA-PKcs expression are decreased after Musashi-1 knockdown, while Musashi-1 expression is induced by irradiation. A, C Surviving fractions of cells after irradiation in Ishikawa (A: 2 Gy and 4 Gy n.s., 6 Gy p = 0.046, n = 14, survival fractions (SF) presented in graph and corresponding table) and KLE cells (C: 2 Gy p = 0.0002, n = 18; SF presented in graph and corresponding table). Note logarithmic scale of y-axis. B, D Representative images of cancer cell colonies. E Protein expression of DNA-PKcs after Msi-1 knockdown (p = 0.008, n = 3 for Ishikawa (relative protein expression level normalized to tubulin 1.36 for ctrl and 1.05 for Msi-1 KD); p = 0.049, n = 4 for KLE (relative protein expression level normalized to tubulin 1.73 for ctrl and 1.16 for Msi-1 KD)). Representative Western Blot signals in Additional file 1: Fig. S4. F Msi-1 mRNA expression in wild-type cells 24 h after irradiation compared to unirradiated cells (p = 0.032 for KLE (mean delta ct values 17.20 for 0 Gy ctrl, 16.78 for 2 Gy irradiated cells), p = 0.042 for Ishikawa (mean delta ct values 16.66 for 0 Gy ctrl, 16.06 for 2 Gy irradiated cells); both n = 4)

