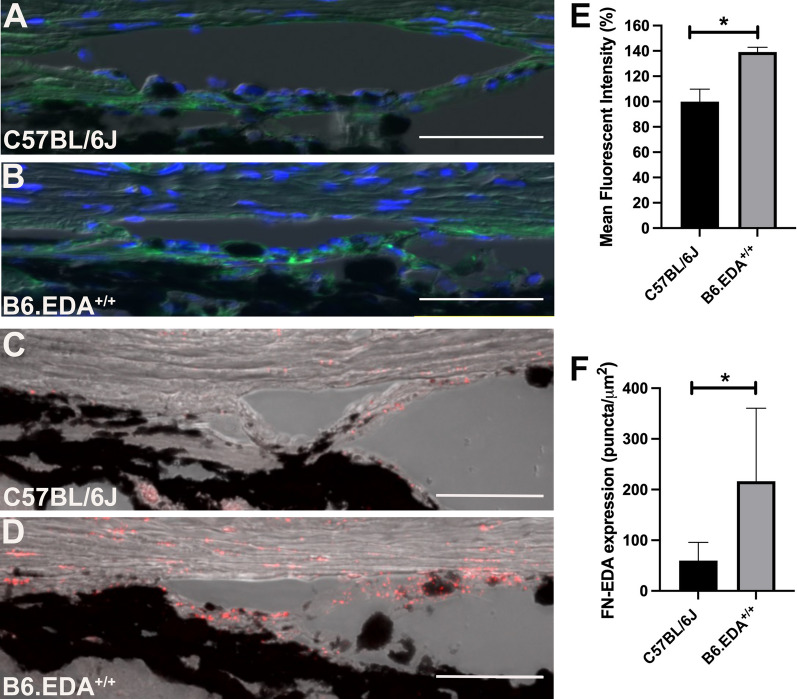
Fig. 1.
Total Fibronectin and Fibronectin-EDA expression is increased in the TM of B6.EDA+/+ mice. A, B Total FN expression is increased in the TM of B6.EDA+/+ mice compared to C57BL/6J controls as shown by immunohistochemical analysis (green labeling). C, D The EDA isoform of FN is increased in the TM of B6.EDA+/+ mice compared to C57BL/6J controls as shown by RNAscope in situ hybridization (red puncta). Both total FN (E) and FN-EDA (F) were significantly increased when quantified by ImageJ analysis of mean fluorescent intensity and puncta/mm2, respectively. Significance determined by Student’s t-test. *p < 0.05, n = 3 mice/strain, scale bar = 50 µm

