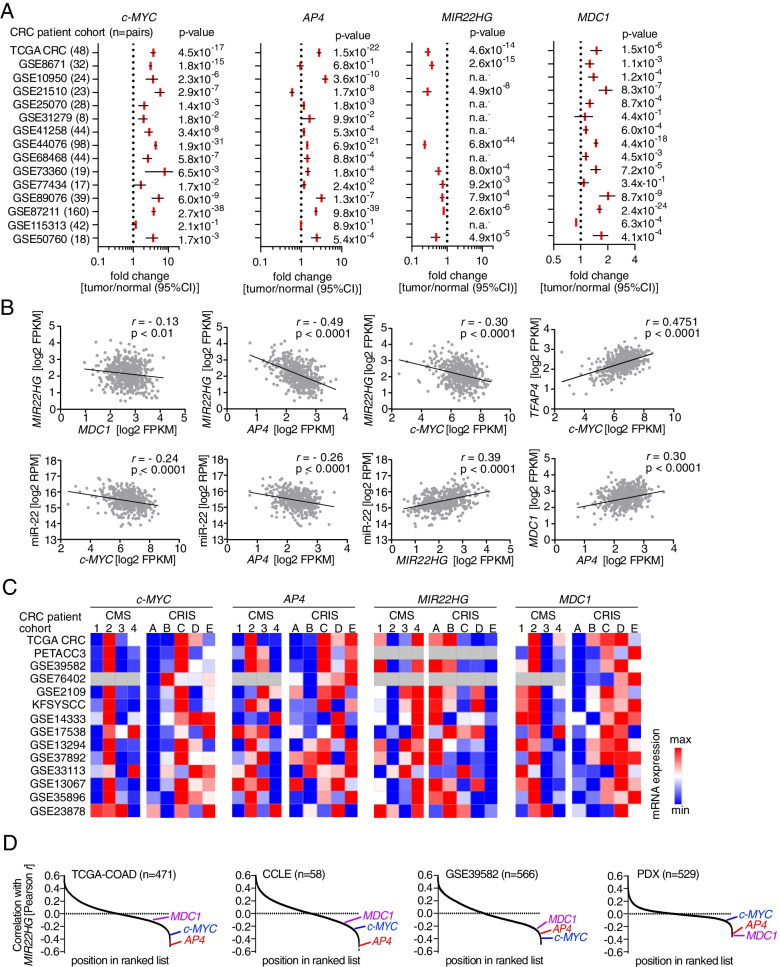
Fig. 5.
Correlations between c-MYC, AP4, MDC1 and miR-22-3p expression in primary CRCs. A Relative expression of the indicated mRNAs detected in expression profiles from patient-derived normal mucosa and tumor tissue deposited in the TCGA-COAD and GEO databases. B Scatter plots of pair-wise comparisons of mRNA expression of the indicated genes in TCGA-COAD samples. C Heat maps of associations between c-MYC, AP4, MIR22HG and MDC1 expression and CMS/CRIS subtypes in the indicated patient cohorts. D RNAs were ranked in descending order according to Pearson correlation coefficient r with MIR22HG expression for the indicated datasets. The positions of MDC1, c-MYC and AP4 expression in the ranked lists are indicated

