Fig. 9.
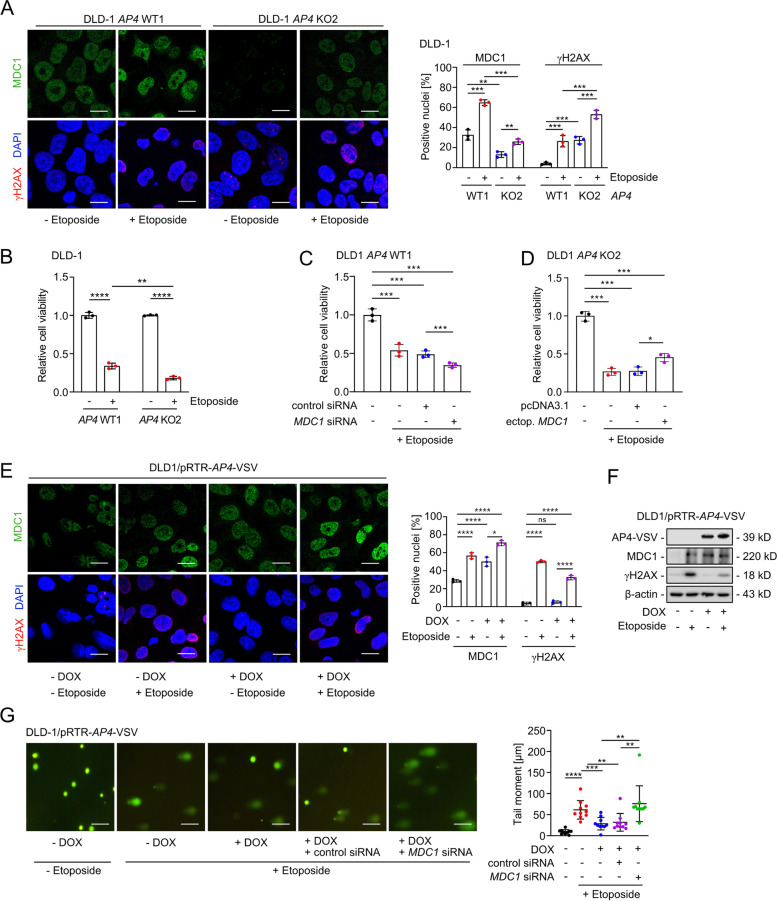
AP4 confers resistance towards Etoposide via MDC1. A Immunofluorescence analysis 12 h after addition of 20 μM Etoposide. Quantification of 3 fields with 120 cells in total. Scale bars: 20 μm. B MTT assay was performed 60 h after treatment with 20 μM Etoposide for 12 h. MTT assay of cells transfected with C the indicated oligonucleotides or D expression plasmids for 48 h and then subjected to treatment with Etoposide for 12 h. E Immunofluorescence analysis after activation of ectopic AP4 expression by treatment with DOX for 48 h and addition of Etoposide for 12 h. Quantification of 3 fields with 120 cells in total. Scale bars: 20 μm. F Western blot analysis of cells treated as in (E). G DNA damage detection by comet assay. Forty-eight hours after activation of ectopic AP4 expression by treatment with DOX, cells were transfected with the indicated oligonucleotides for 48 h and then treated with Etoposide for 12 h. For the last 60 h fresh DOX was added. Quantification of DNA tail moment by evaluation of 10 fields with 150 cells in total, Scale bars: 10 μm. The mean + SD is provided in A-E with (n=3) and in G with (n=10) and *:p < 0.05, **:p < 0.01, ***:p < 0.001, ****:p < 0.0001

