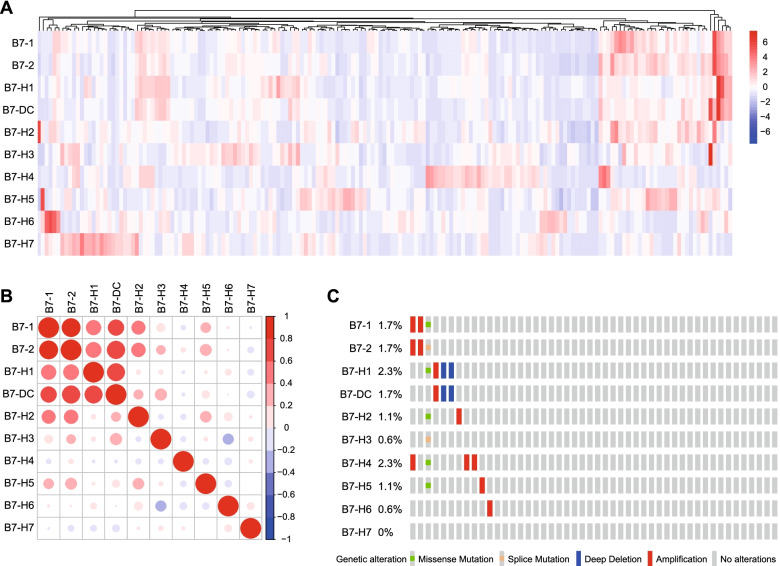
Fig. 1.
Expression, correlation and mutation of B7 family in PaCa. A Expression patterns of B7 molecules in PaCa in the TCGA dataset were summarized in the heatmap. Red: high expression, blue: low expression. B Correlations of B7 molecules in PaCa in the TCGA dataset were summarized in the heatmap. The color reveals the Pearson correlation coefficient. C OncoPrint in the cBioPortal database exhibited the proportion and distribution of specimens with genetic alterations in B7 molecules. Gene expression and genetic alteration data were obtained from the cBioPortal portal (http://www.cbioportal.org/datasets)

